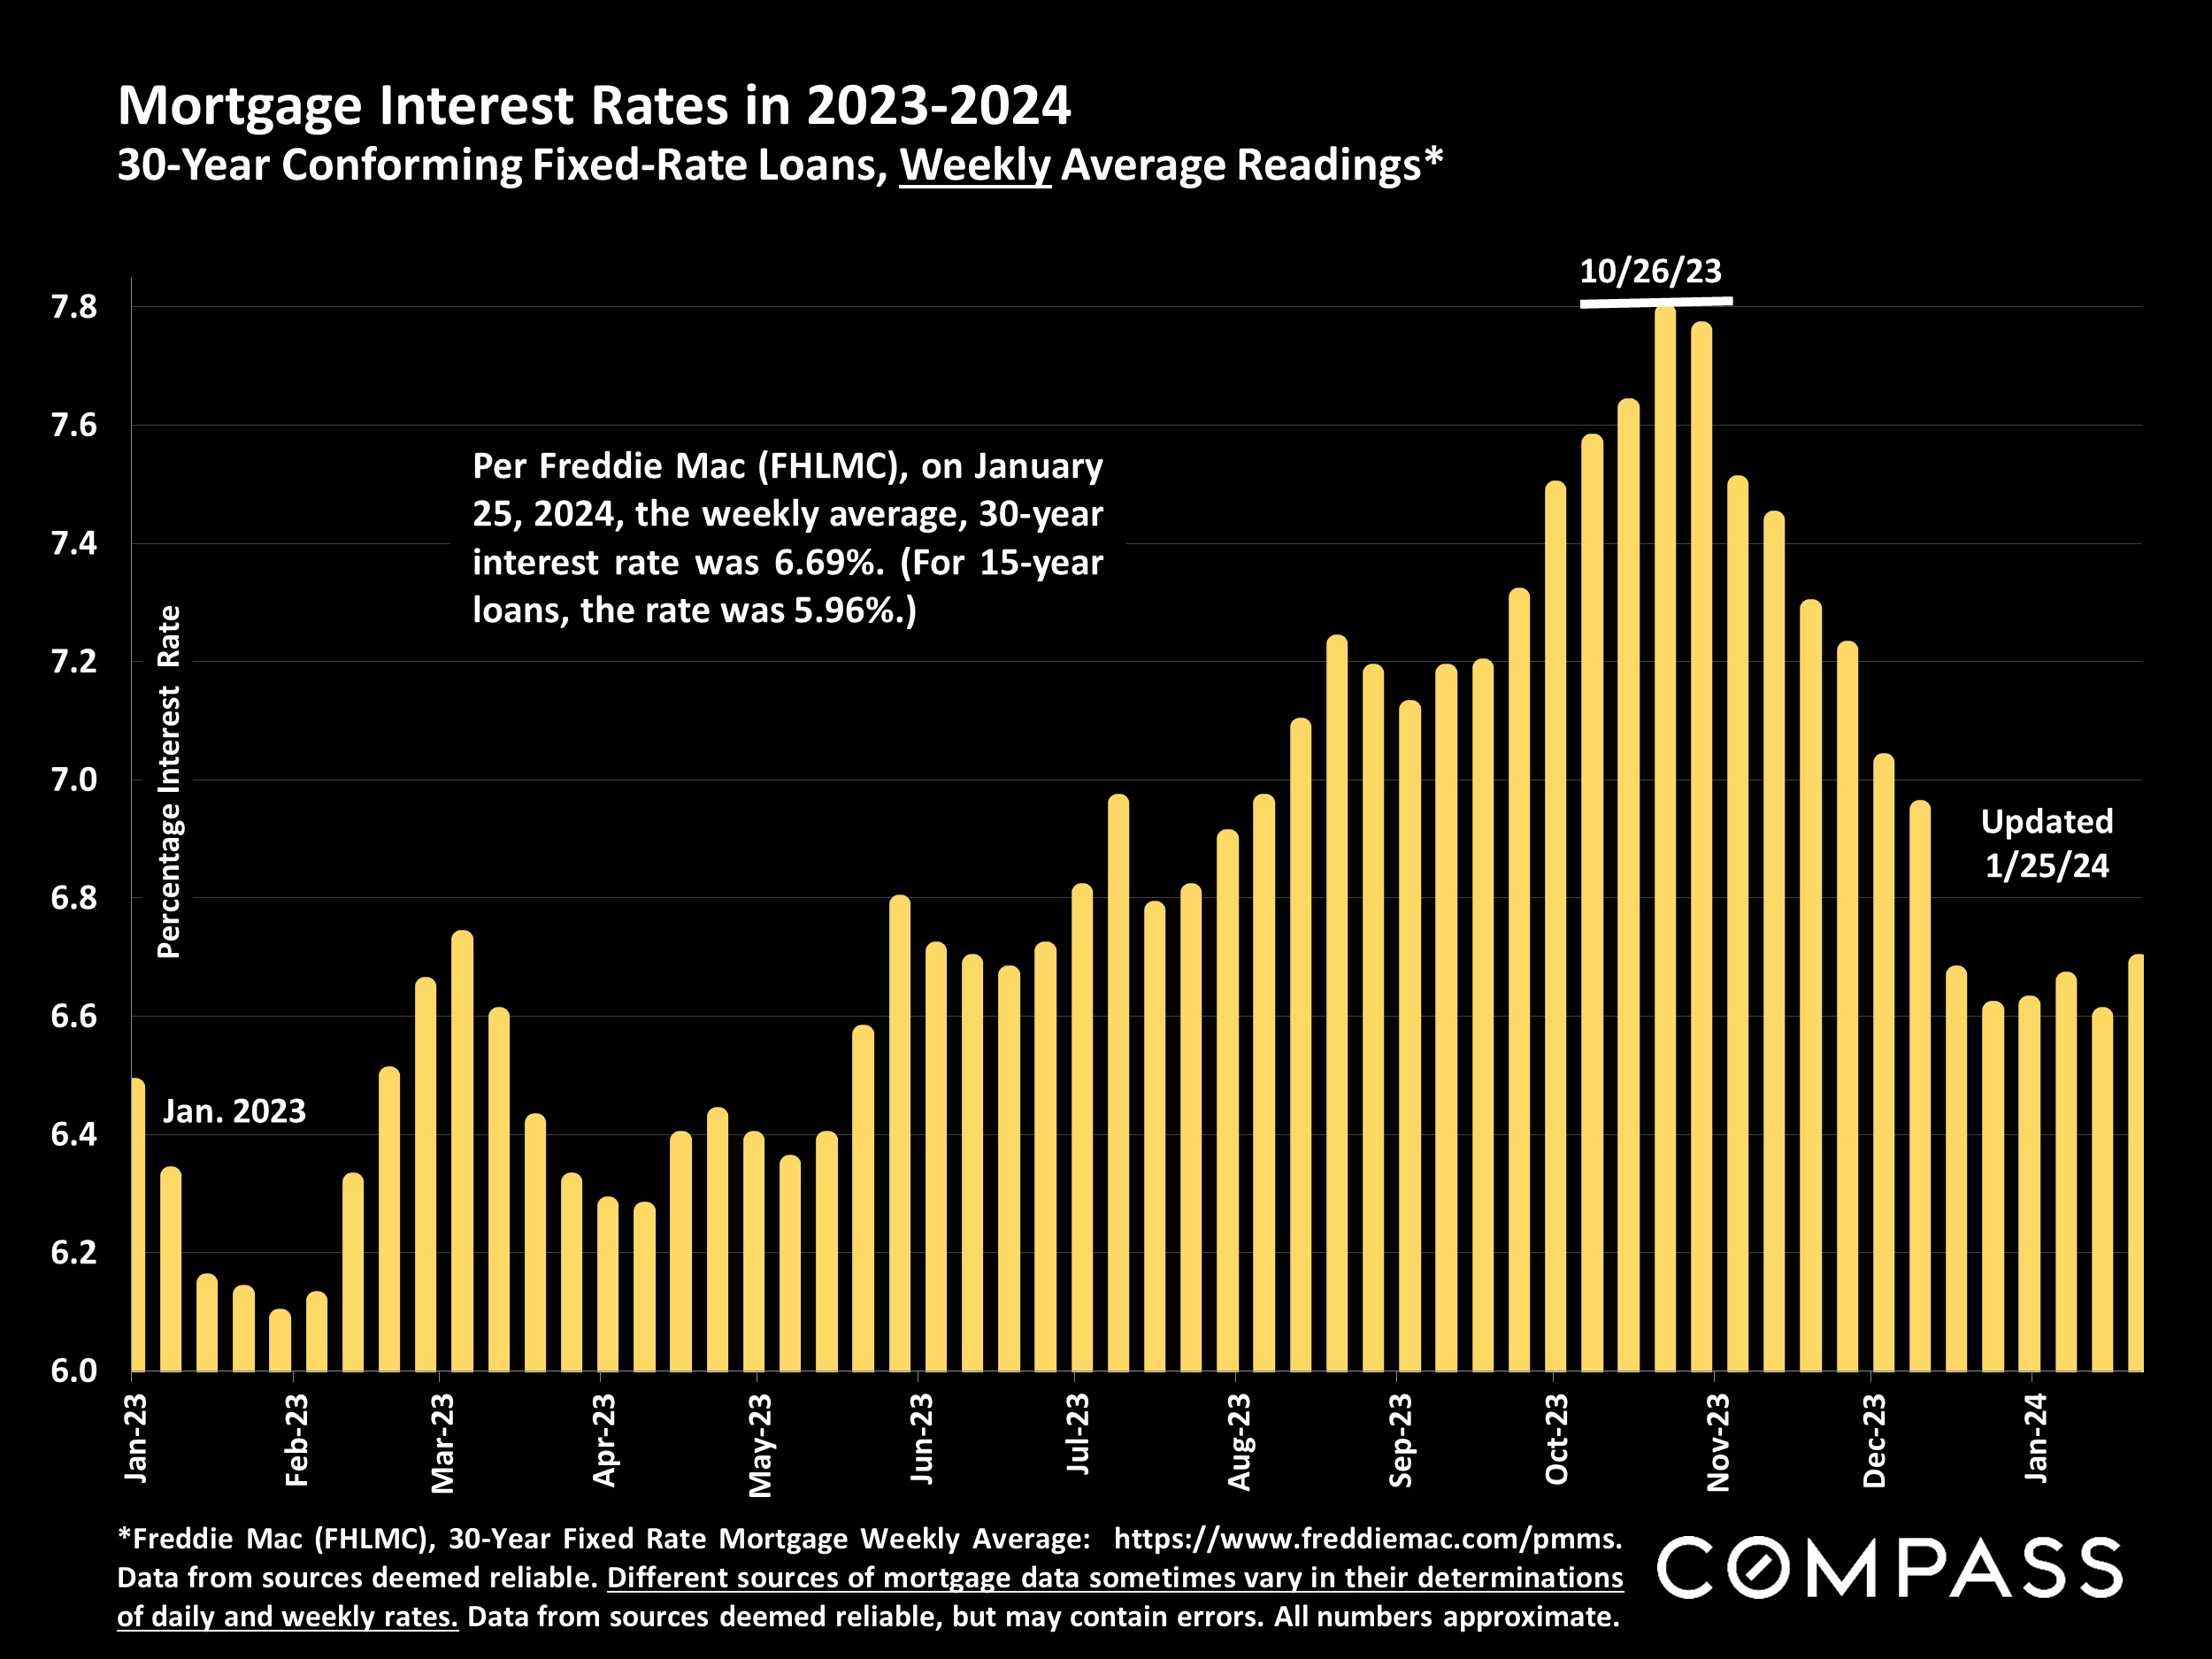
After their steep plunge in November and December, interest rates leveled off in January, but remain at their lowest point since spring 2023.
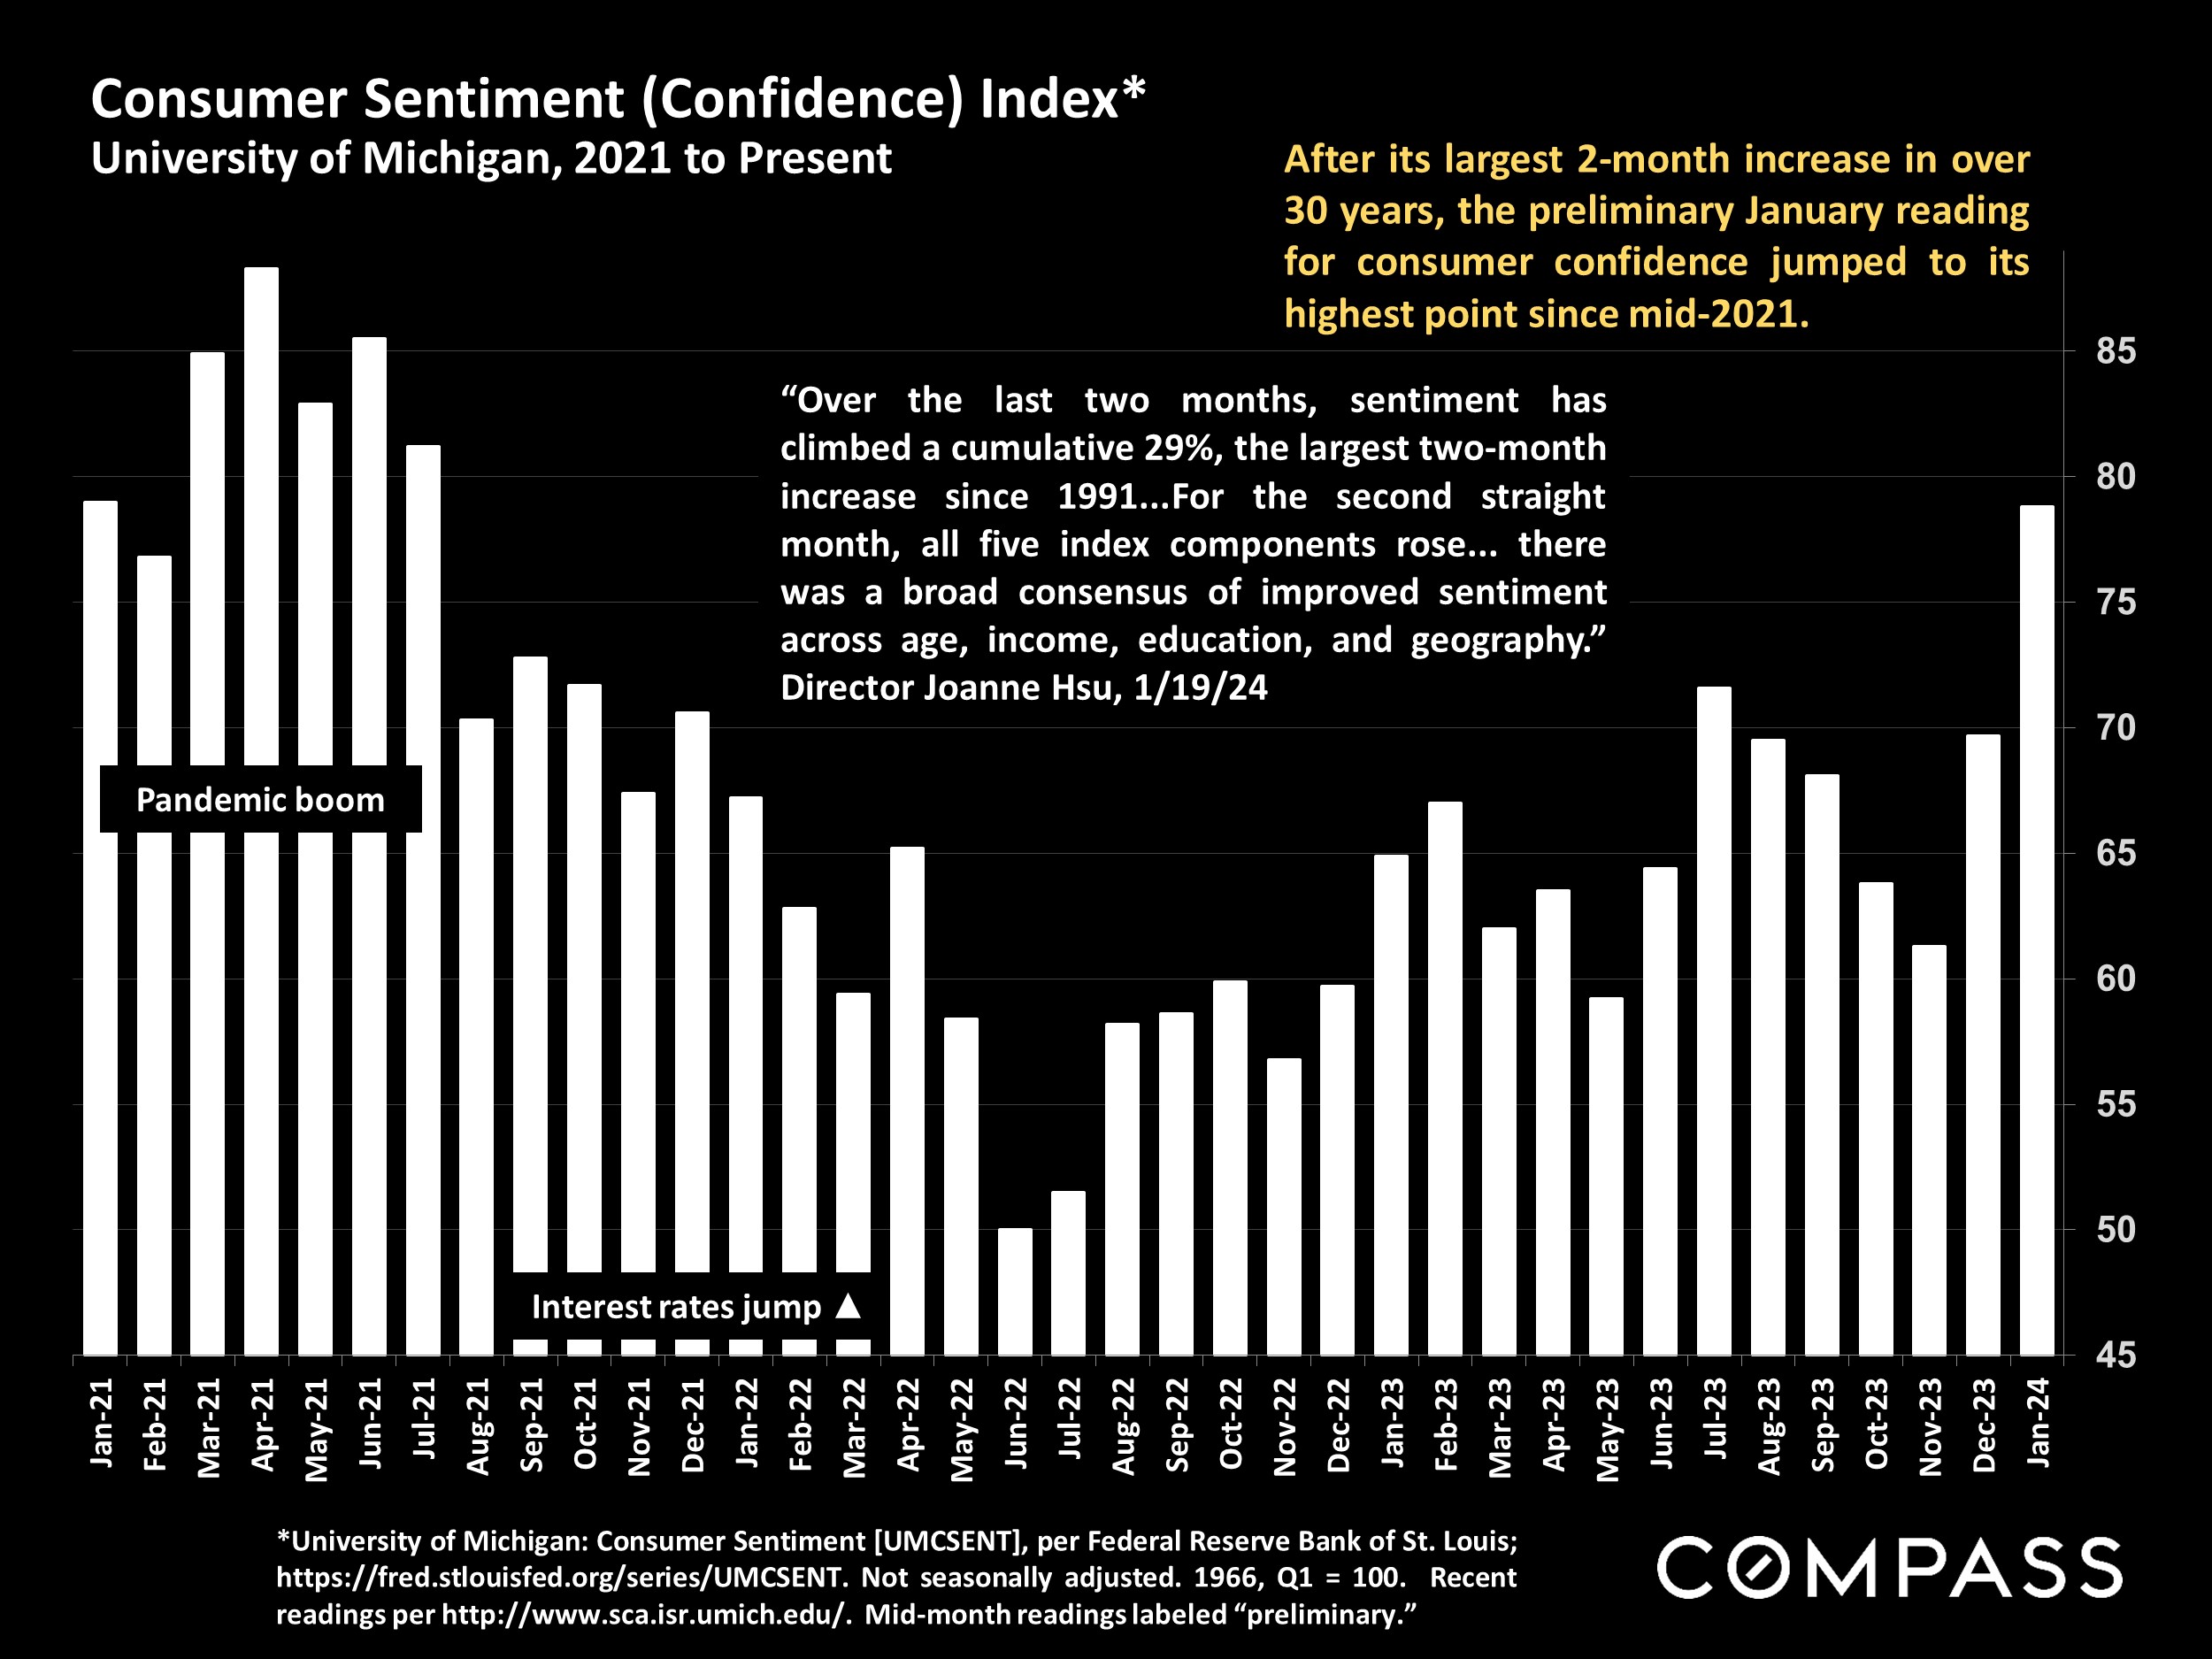
A huge improvement in consumer confidence occurred in the last 2 months: Economic optimism is a critical driver of buyer demand.
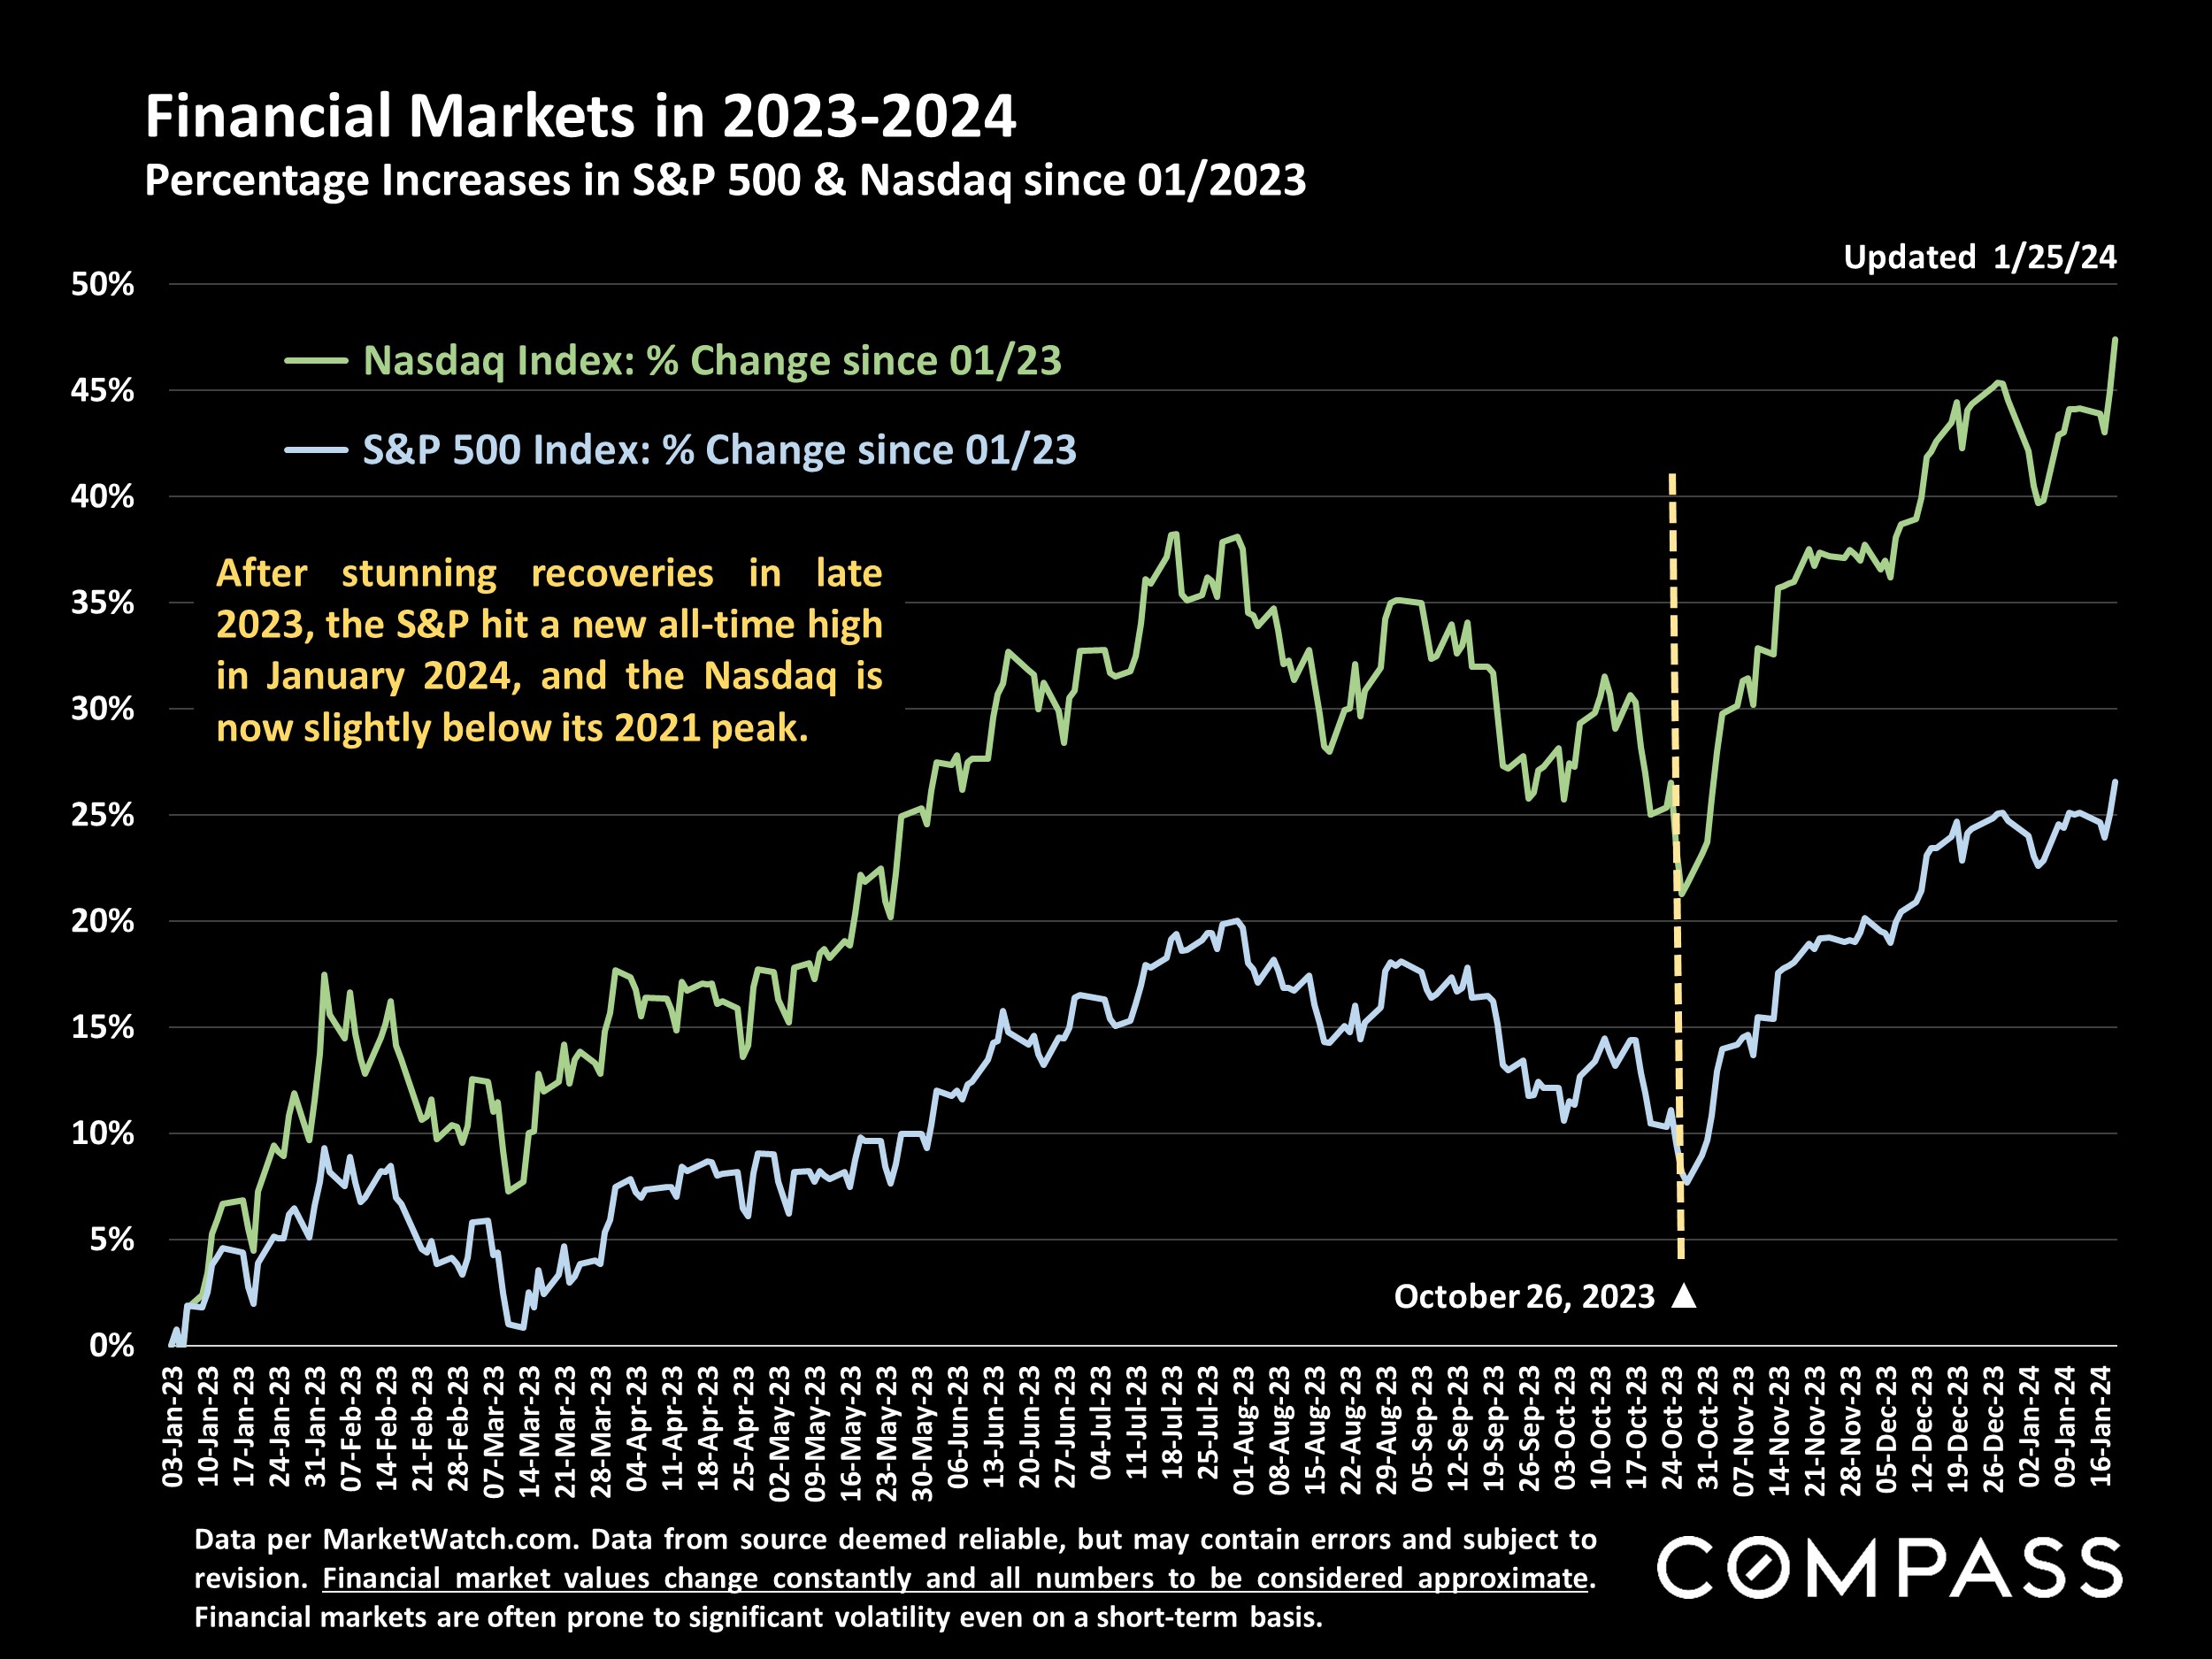
Changes in financial market values impact household wealth, consumer confidence, and housing markets. Stock markets have soared since late October.
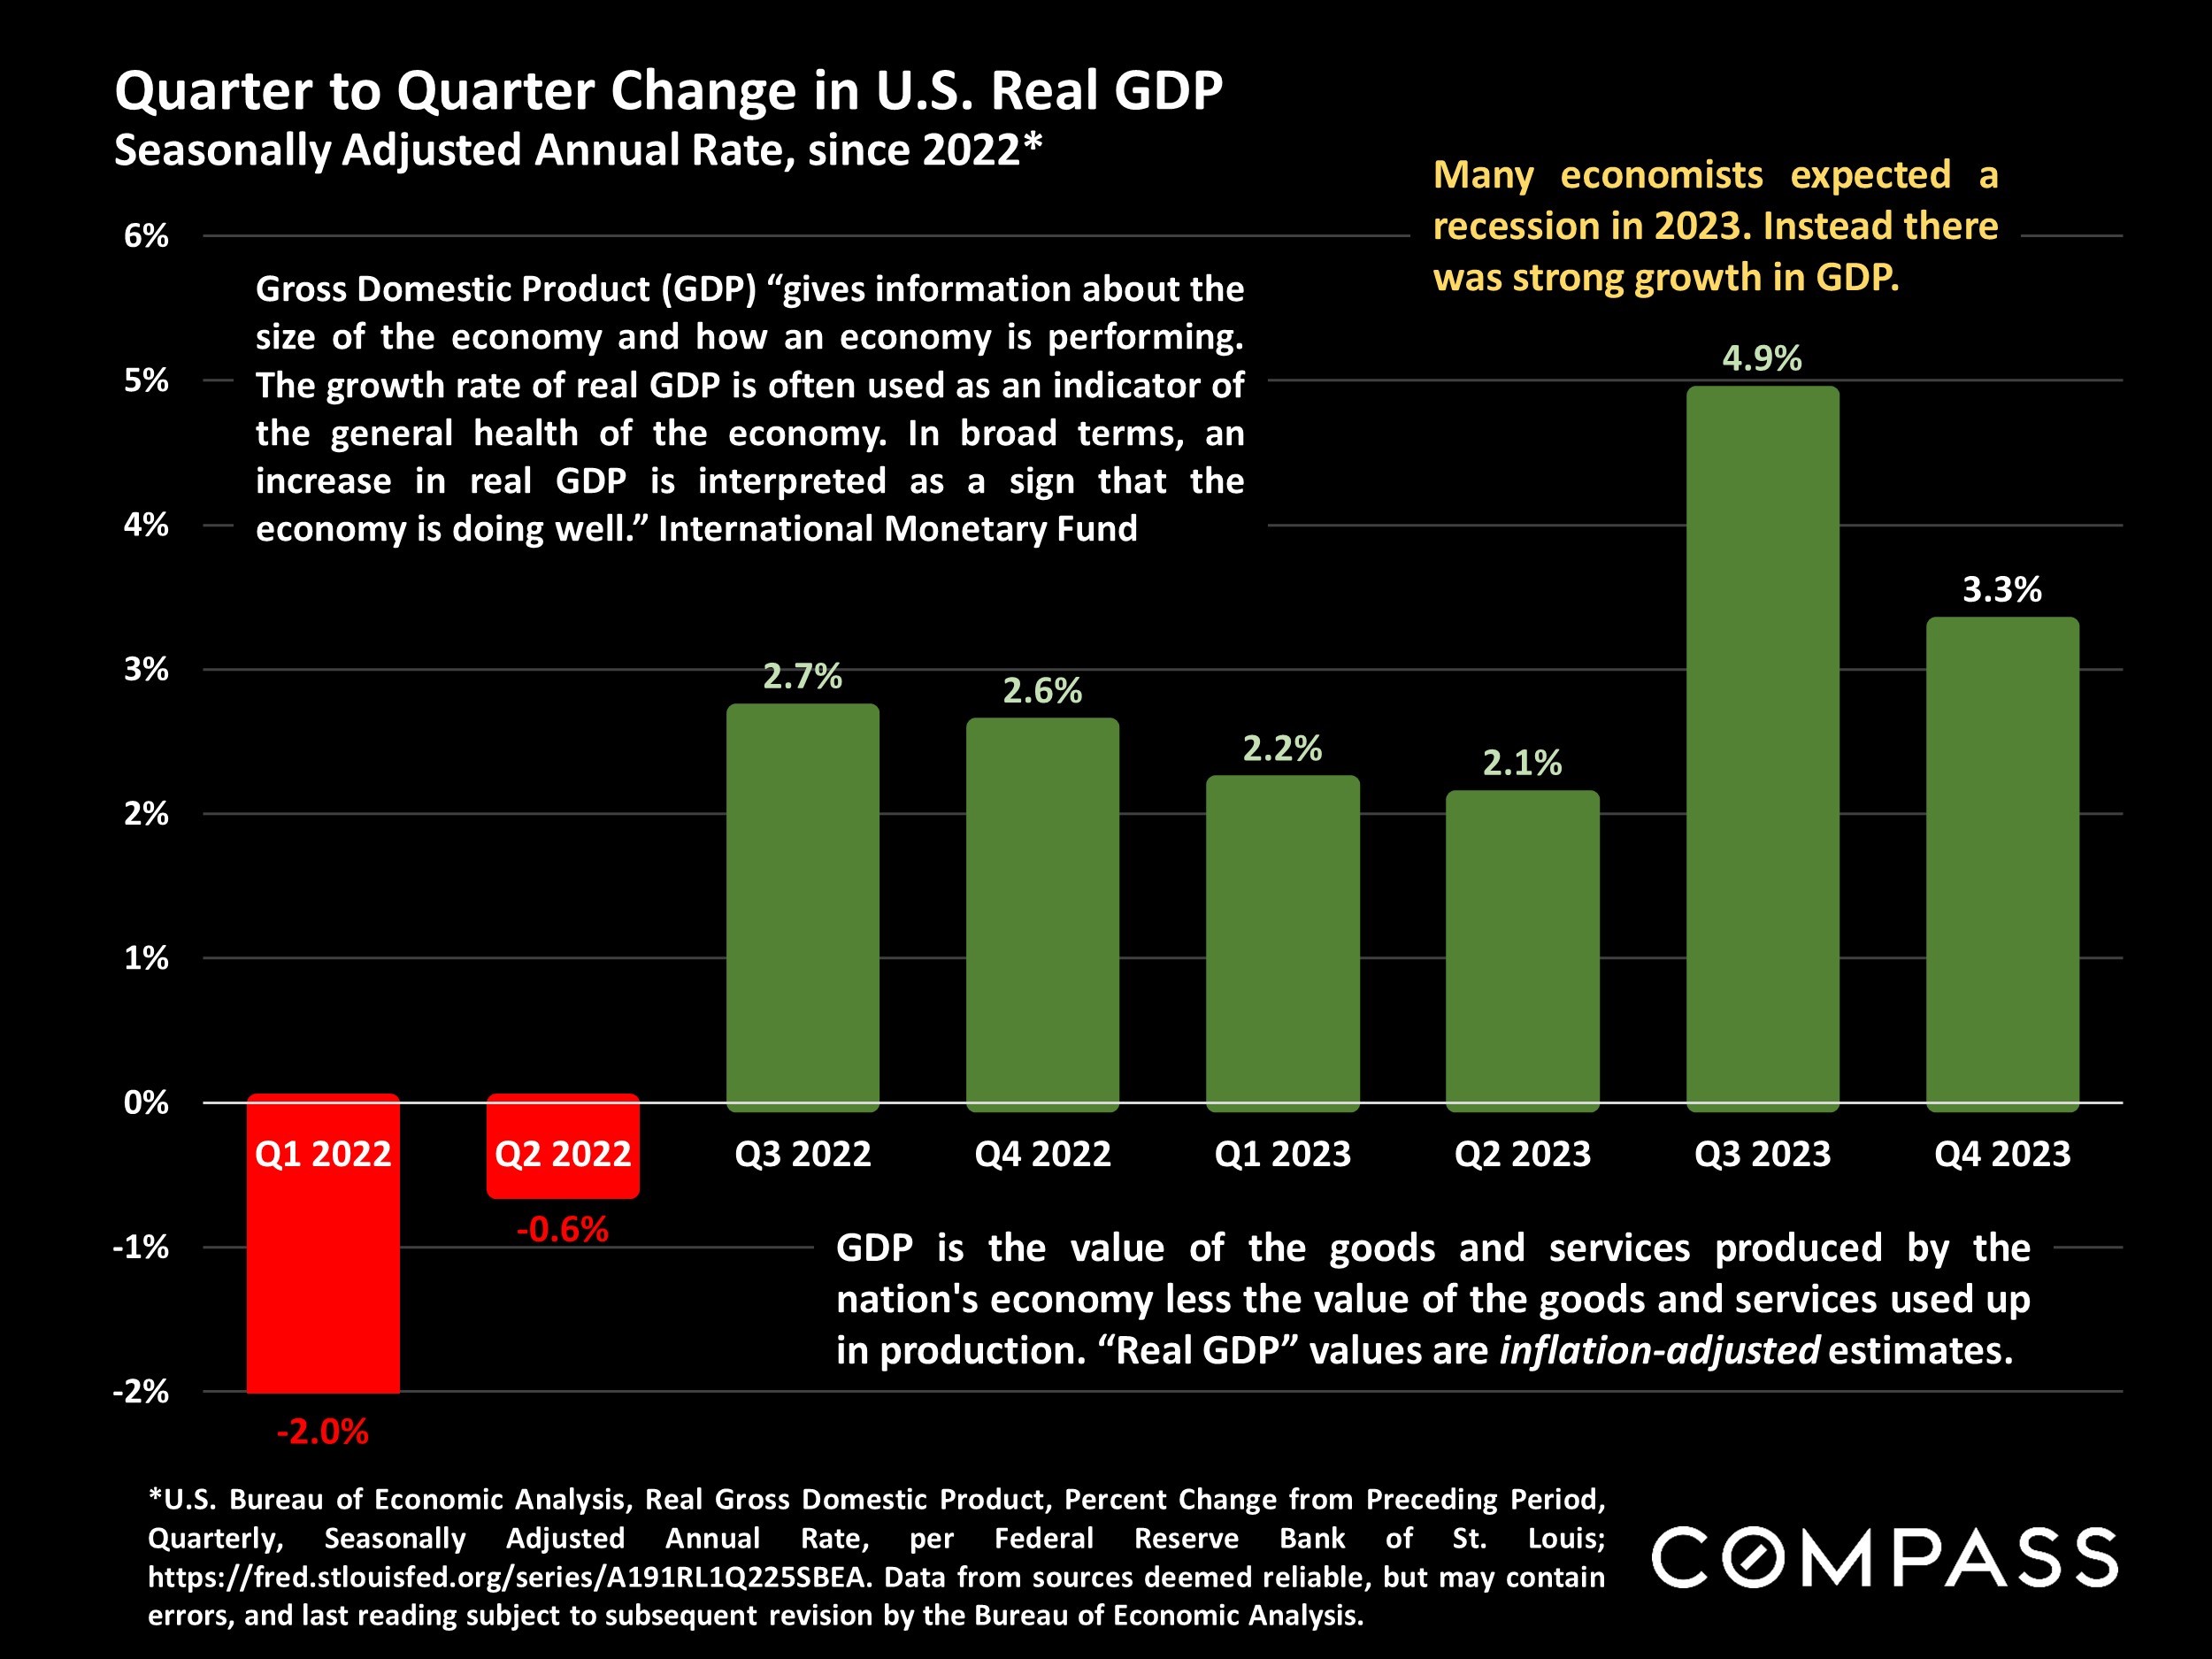
The economy in 2023 far outperformed the fears and low expectations
with which the year began.
In recent years, investors have played an outsized role in the market as they’ve aggressively competed with ordinary homebuyers for listings.
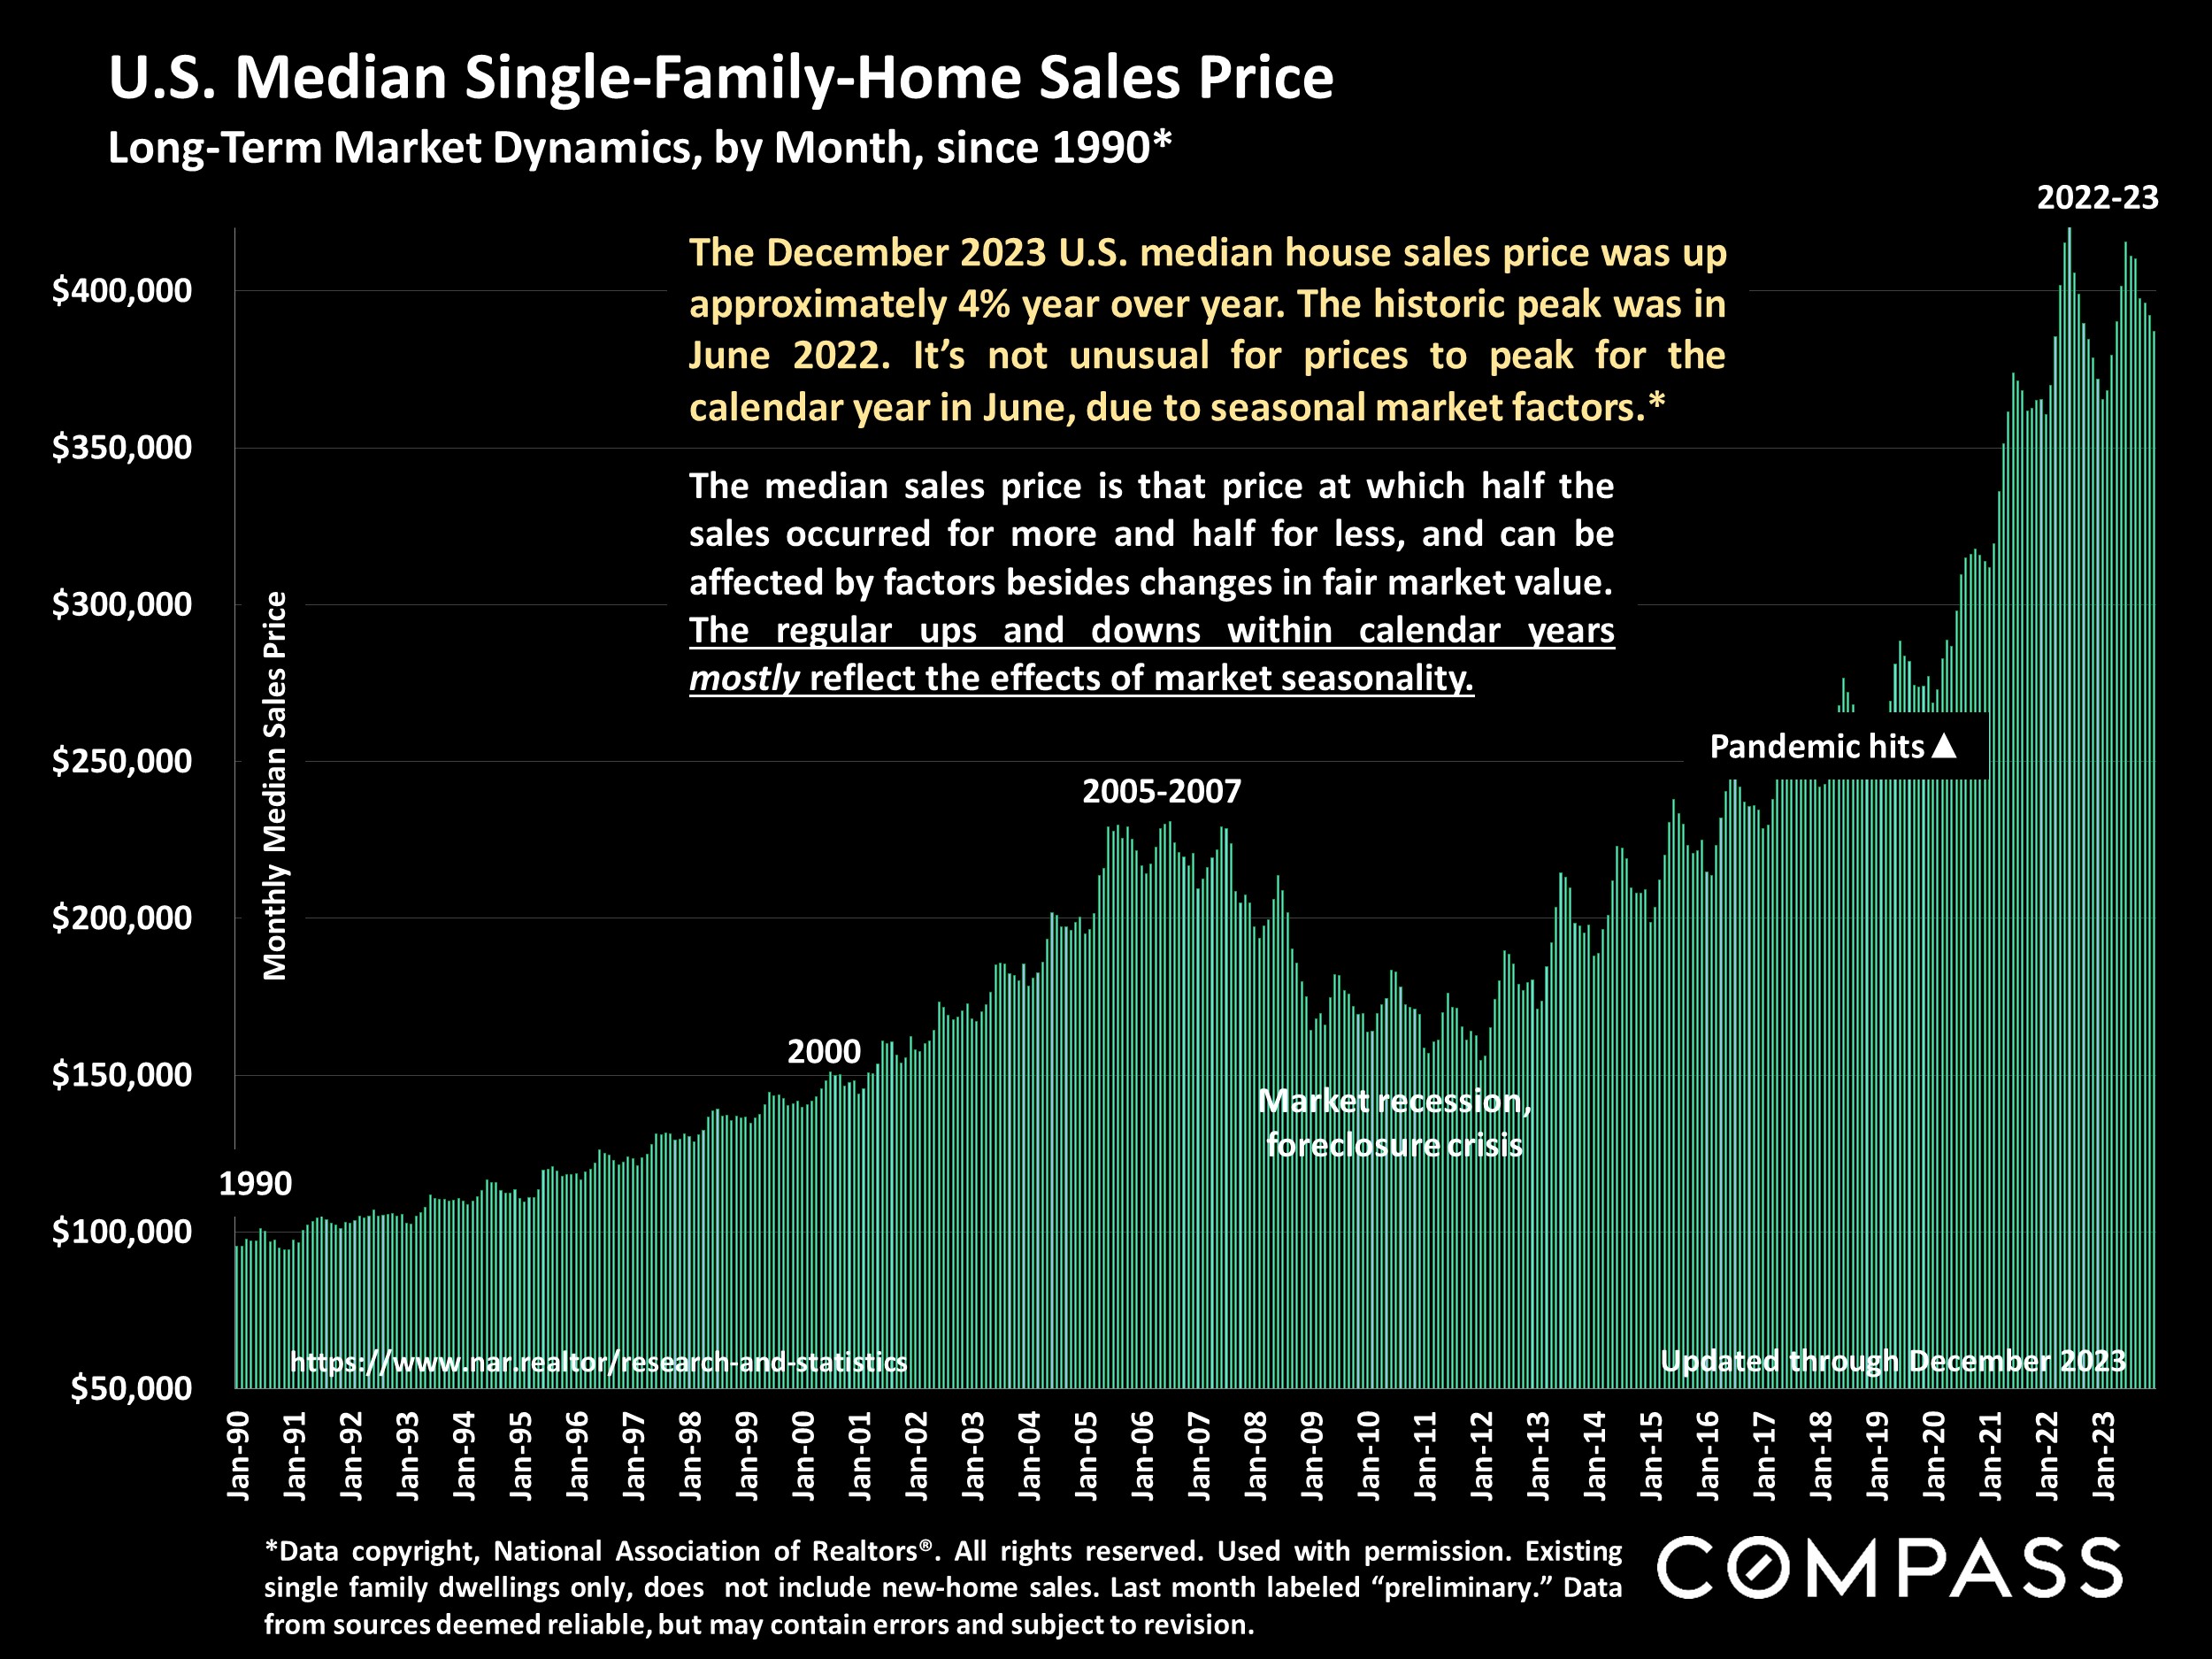
National median house sales prices in 2023 came very close to the spring 2022 peak. Recent monthly prices are up on a year-over-year basis.
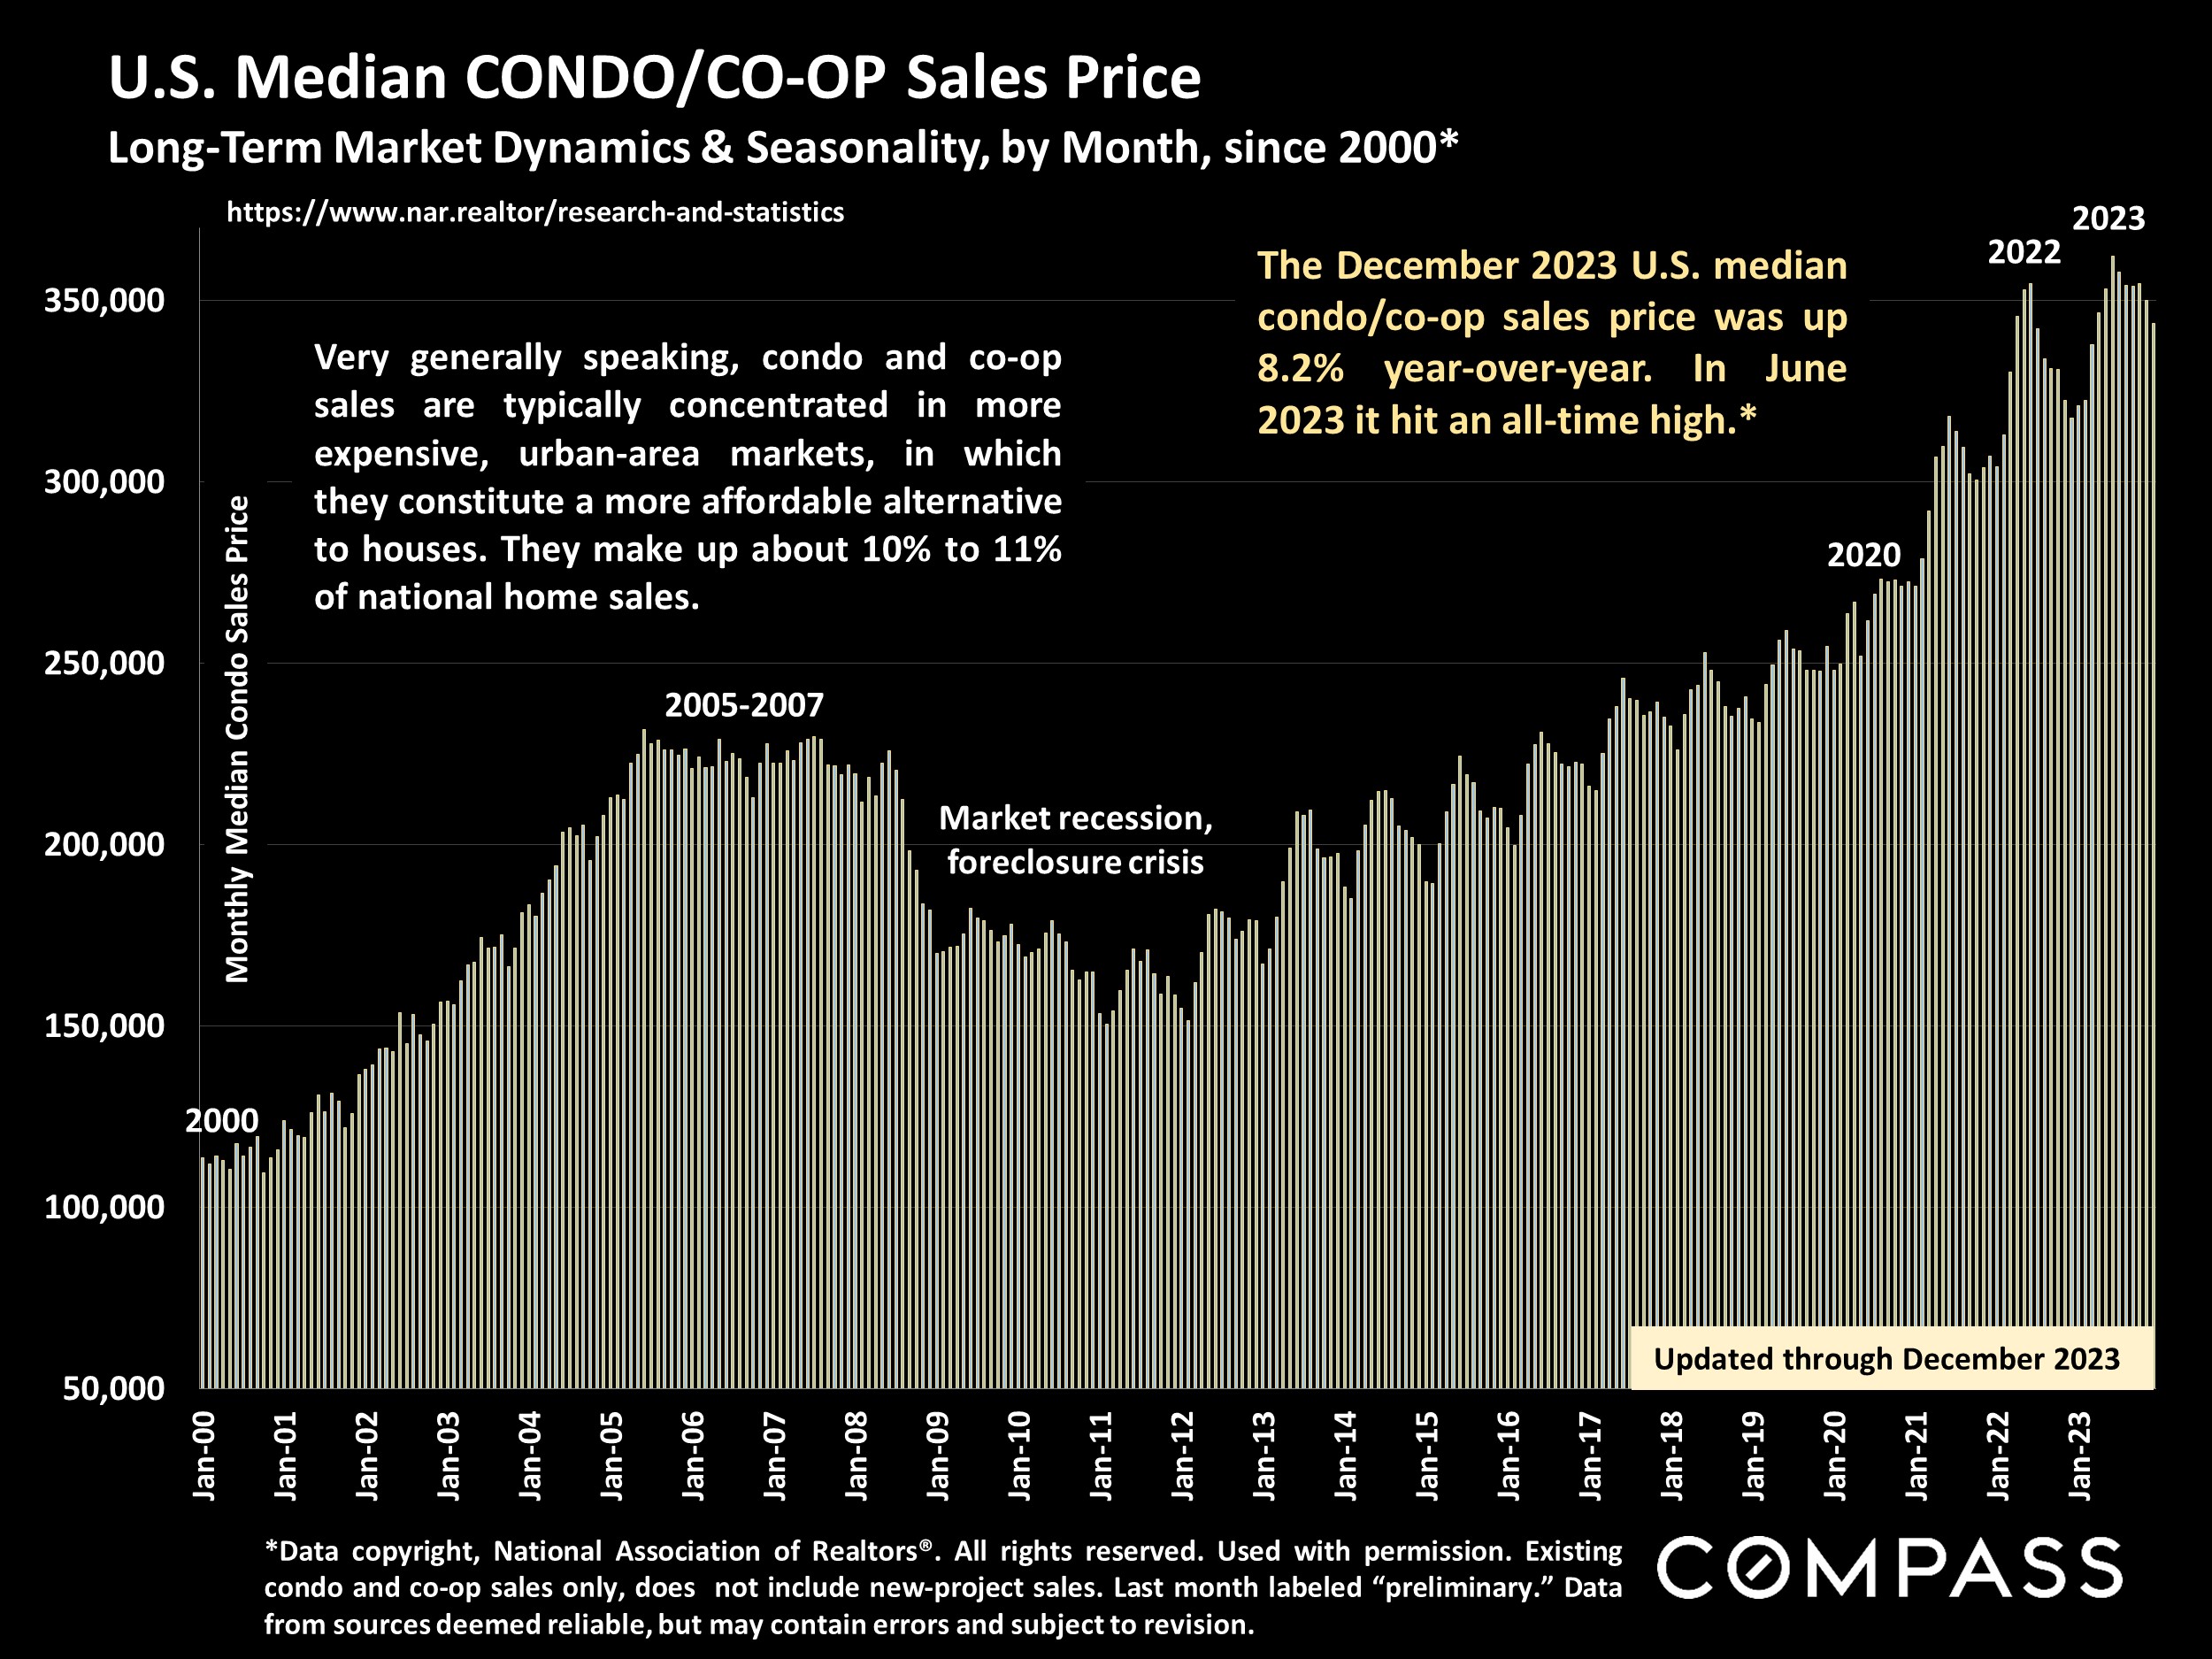
Perhaps due to their relative affordability in the markets in which they’re common, the median condo/co-op sales price hit an all-time high in 2023.
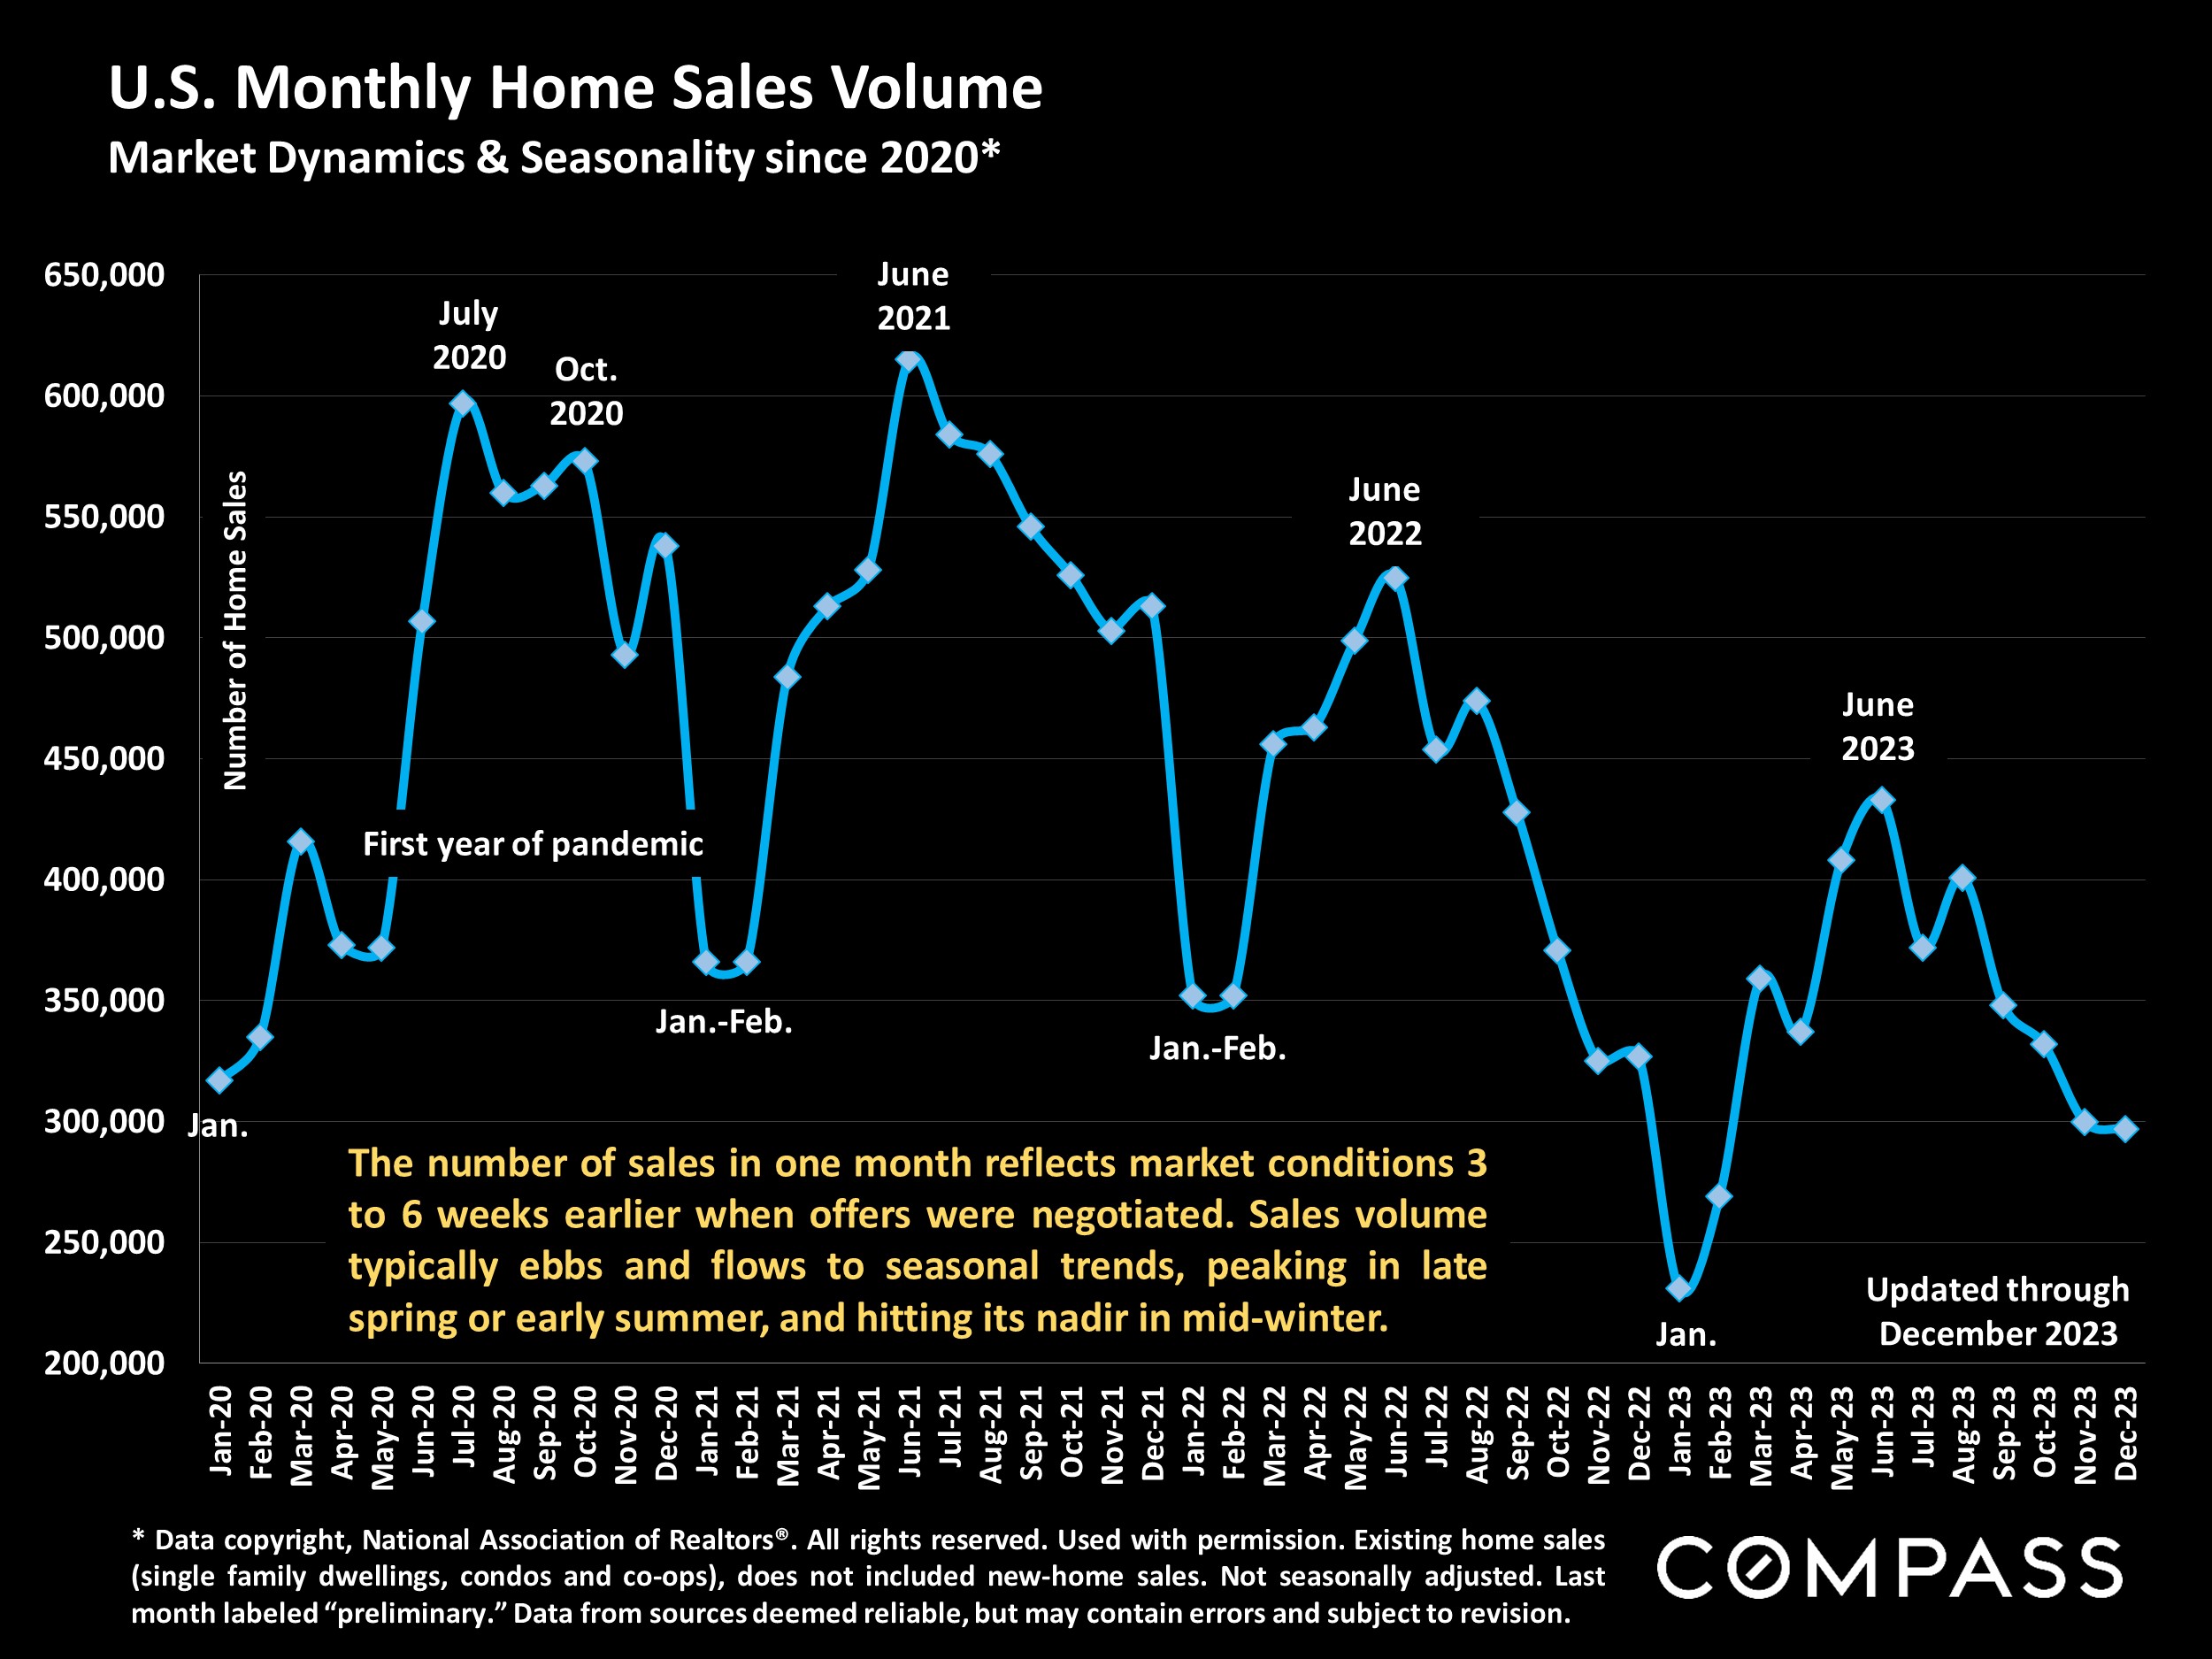
Late 2023 market data wasn’t significantly impacted by the improvements in economic conditions that began late last year. January data, due in late February, will be a much more important indicator, but the following charts illustrate trends and conditions in recent years, as well asthe dramatic role of seasonality.
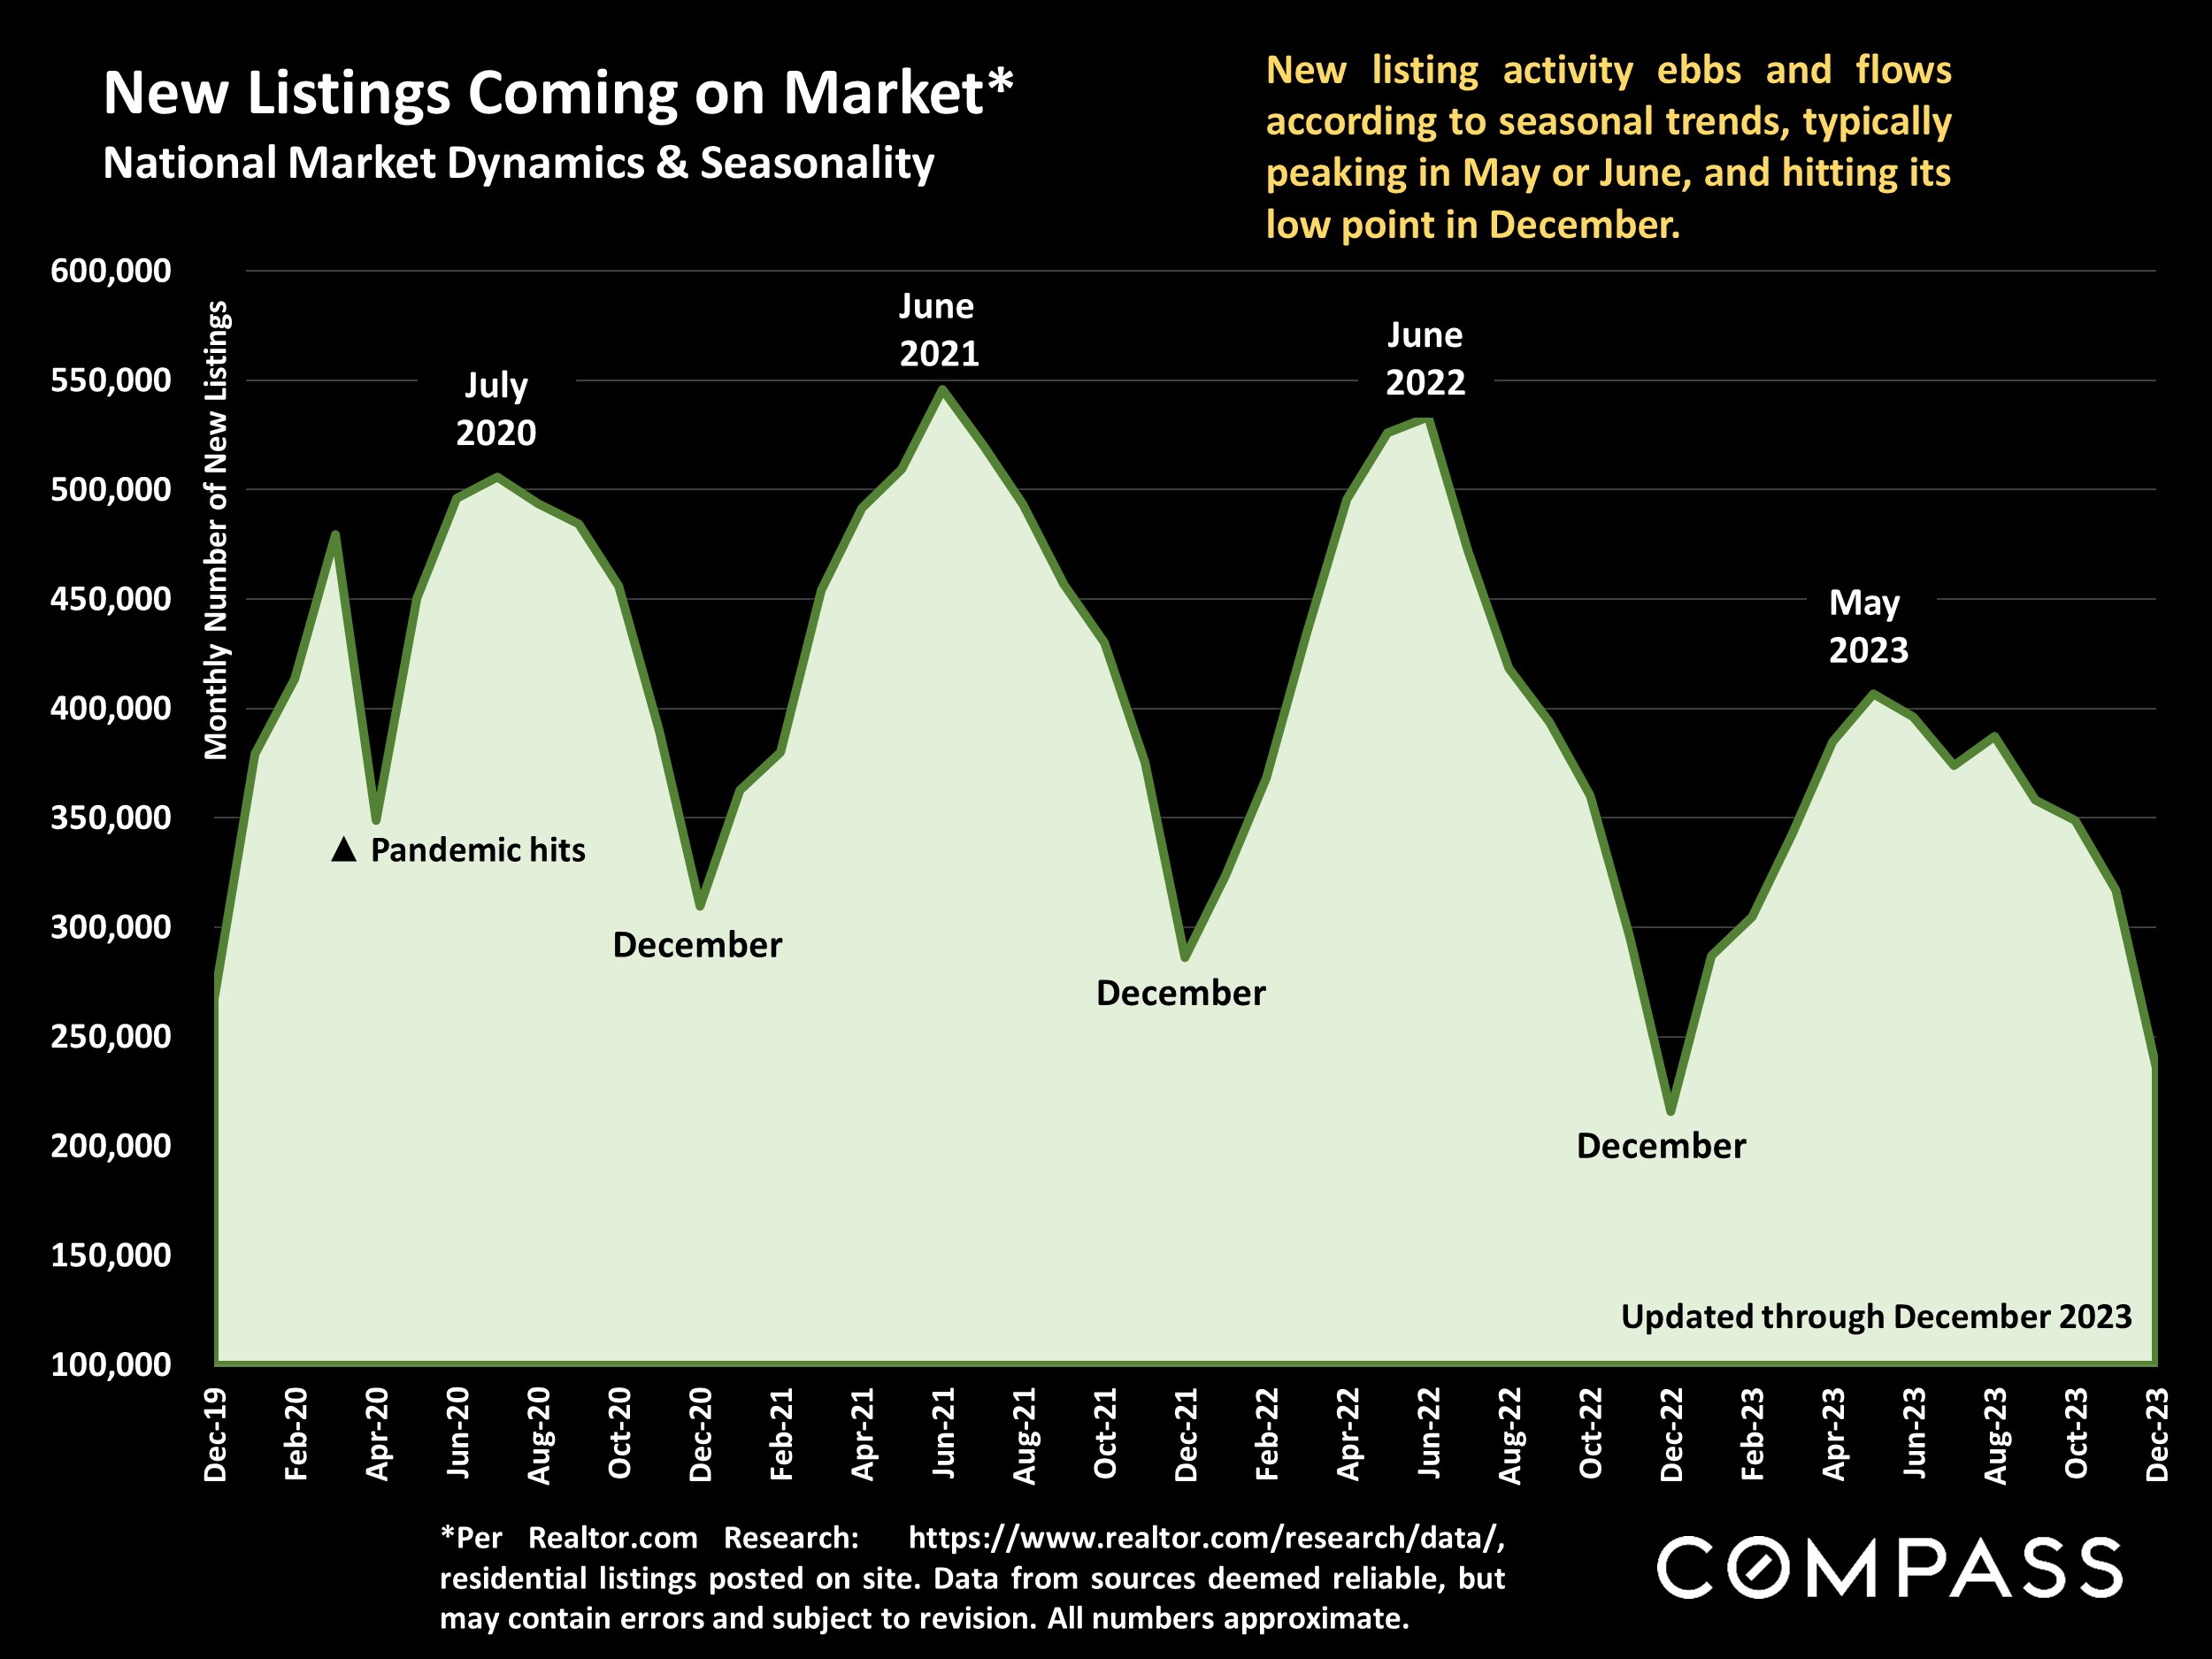
The number of new listings plunged since mid-2022, and December normally sees the lowest number of the year. Preliminary weekly data has early-2024 new listing activity up year-over-year. New listings typically climb rapidly through spring.
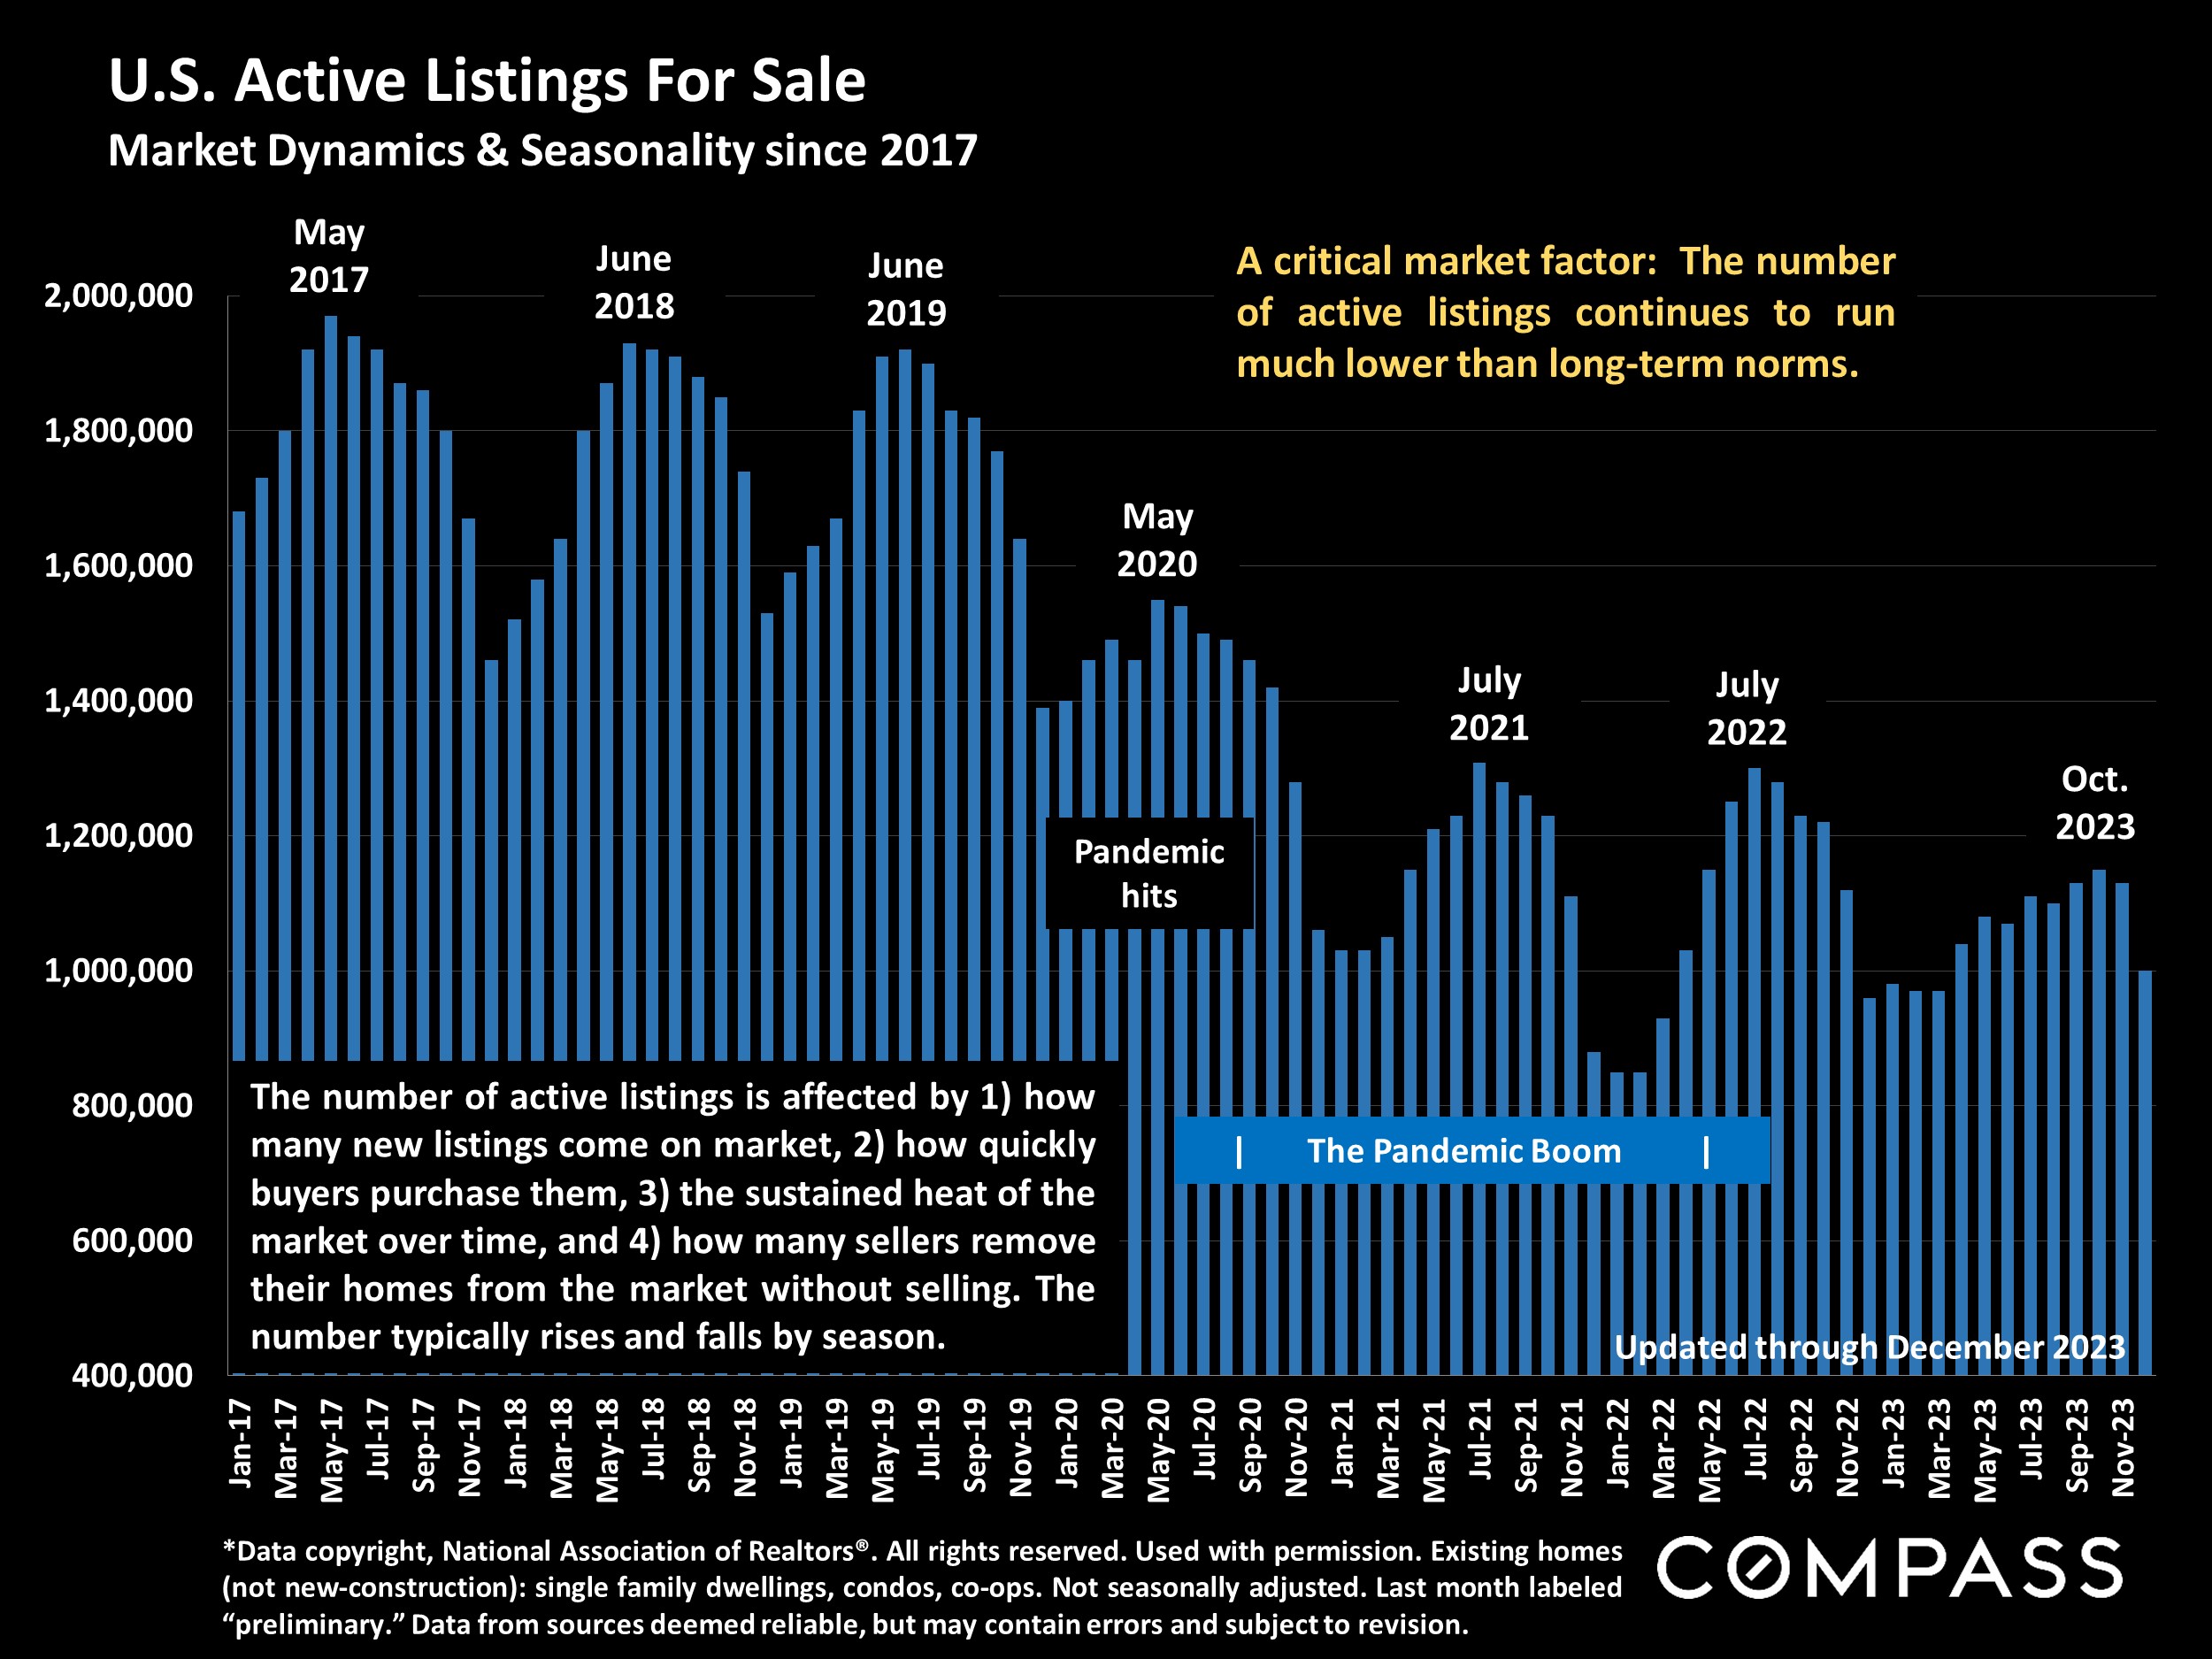
The inventory of active listings is mostly determined by the number of new listings, and how quickly buyers snap them up. Inventory rises rapidly as the new year’s market wakes up, but will probably remain well below long-term norms.
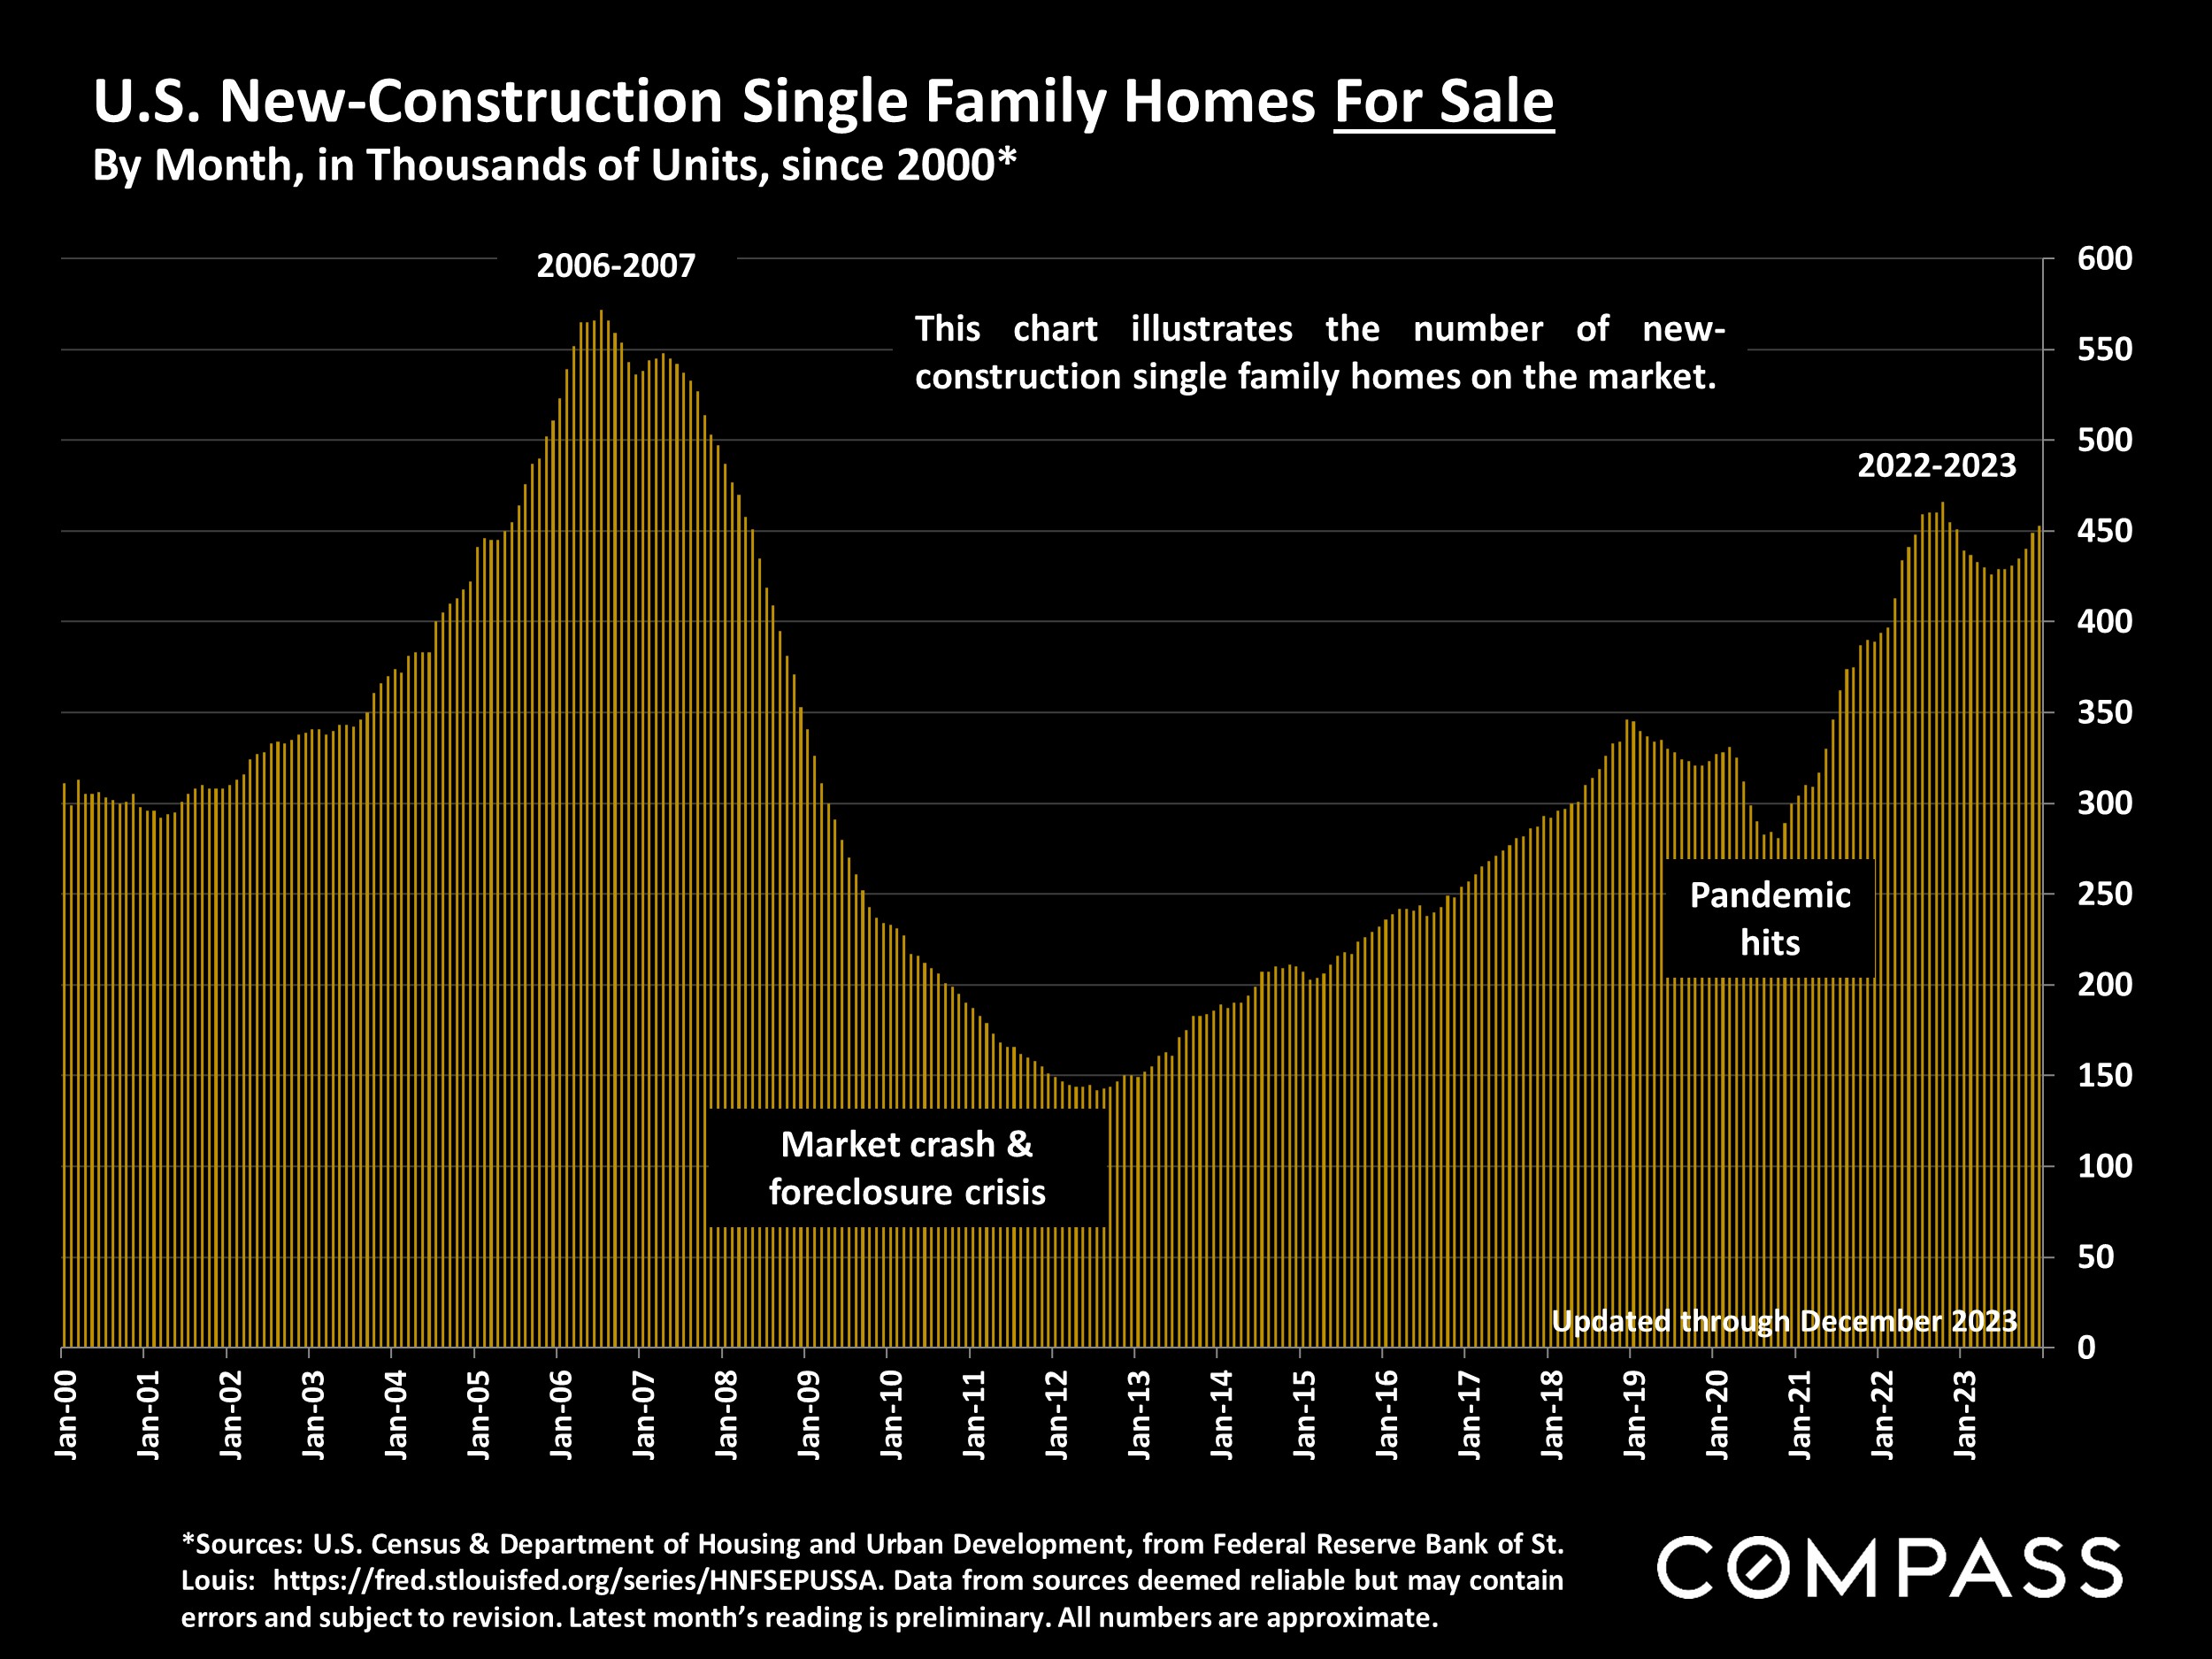
While many homeowners have held back from listing their homes, the inventory of
new-construction houses is approaching its 10-year high in 2022. Developers are eager to take advantage of unmet buyer demand.
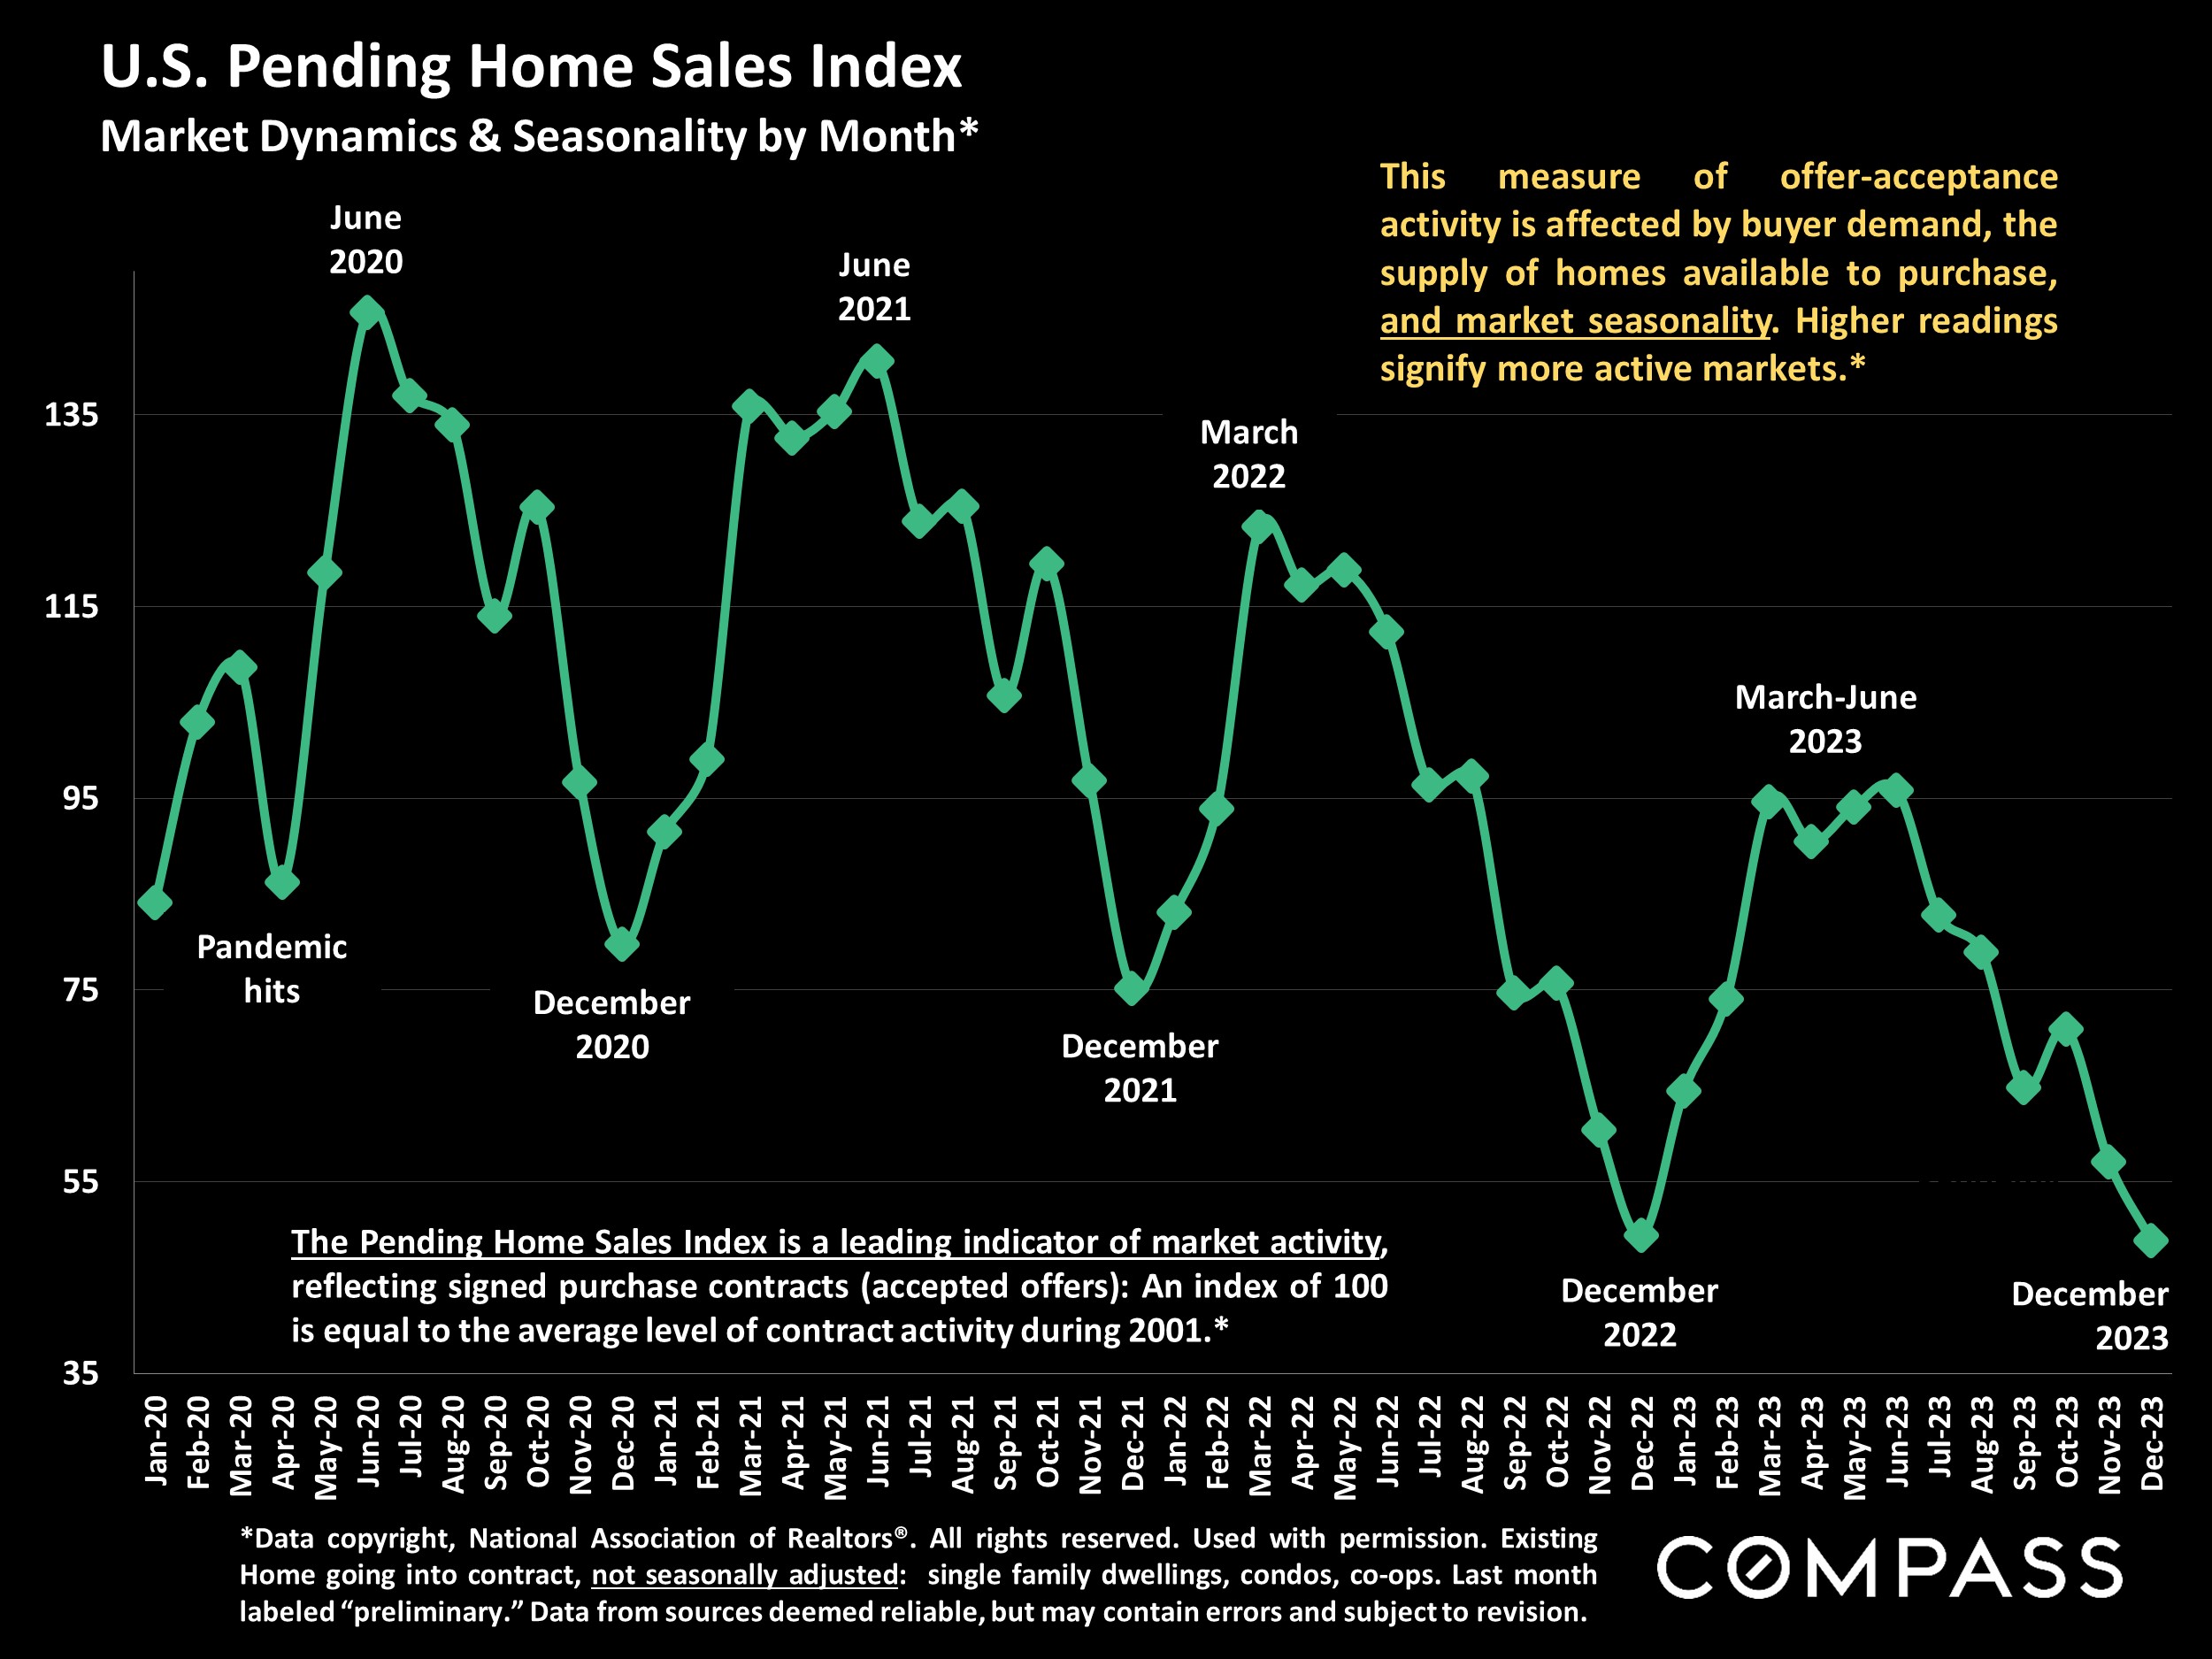
Accepted-offer activity is a leading indicator for near-future sales. It usually hits its low point in December, then heats up quickly moving into spring.
Sales generally follow offer acceptance by 3-6 weeks, the typical period from contract negotiation to close of escrow. 2023 sales were far below historical norms.
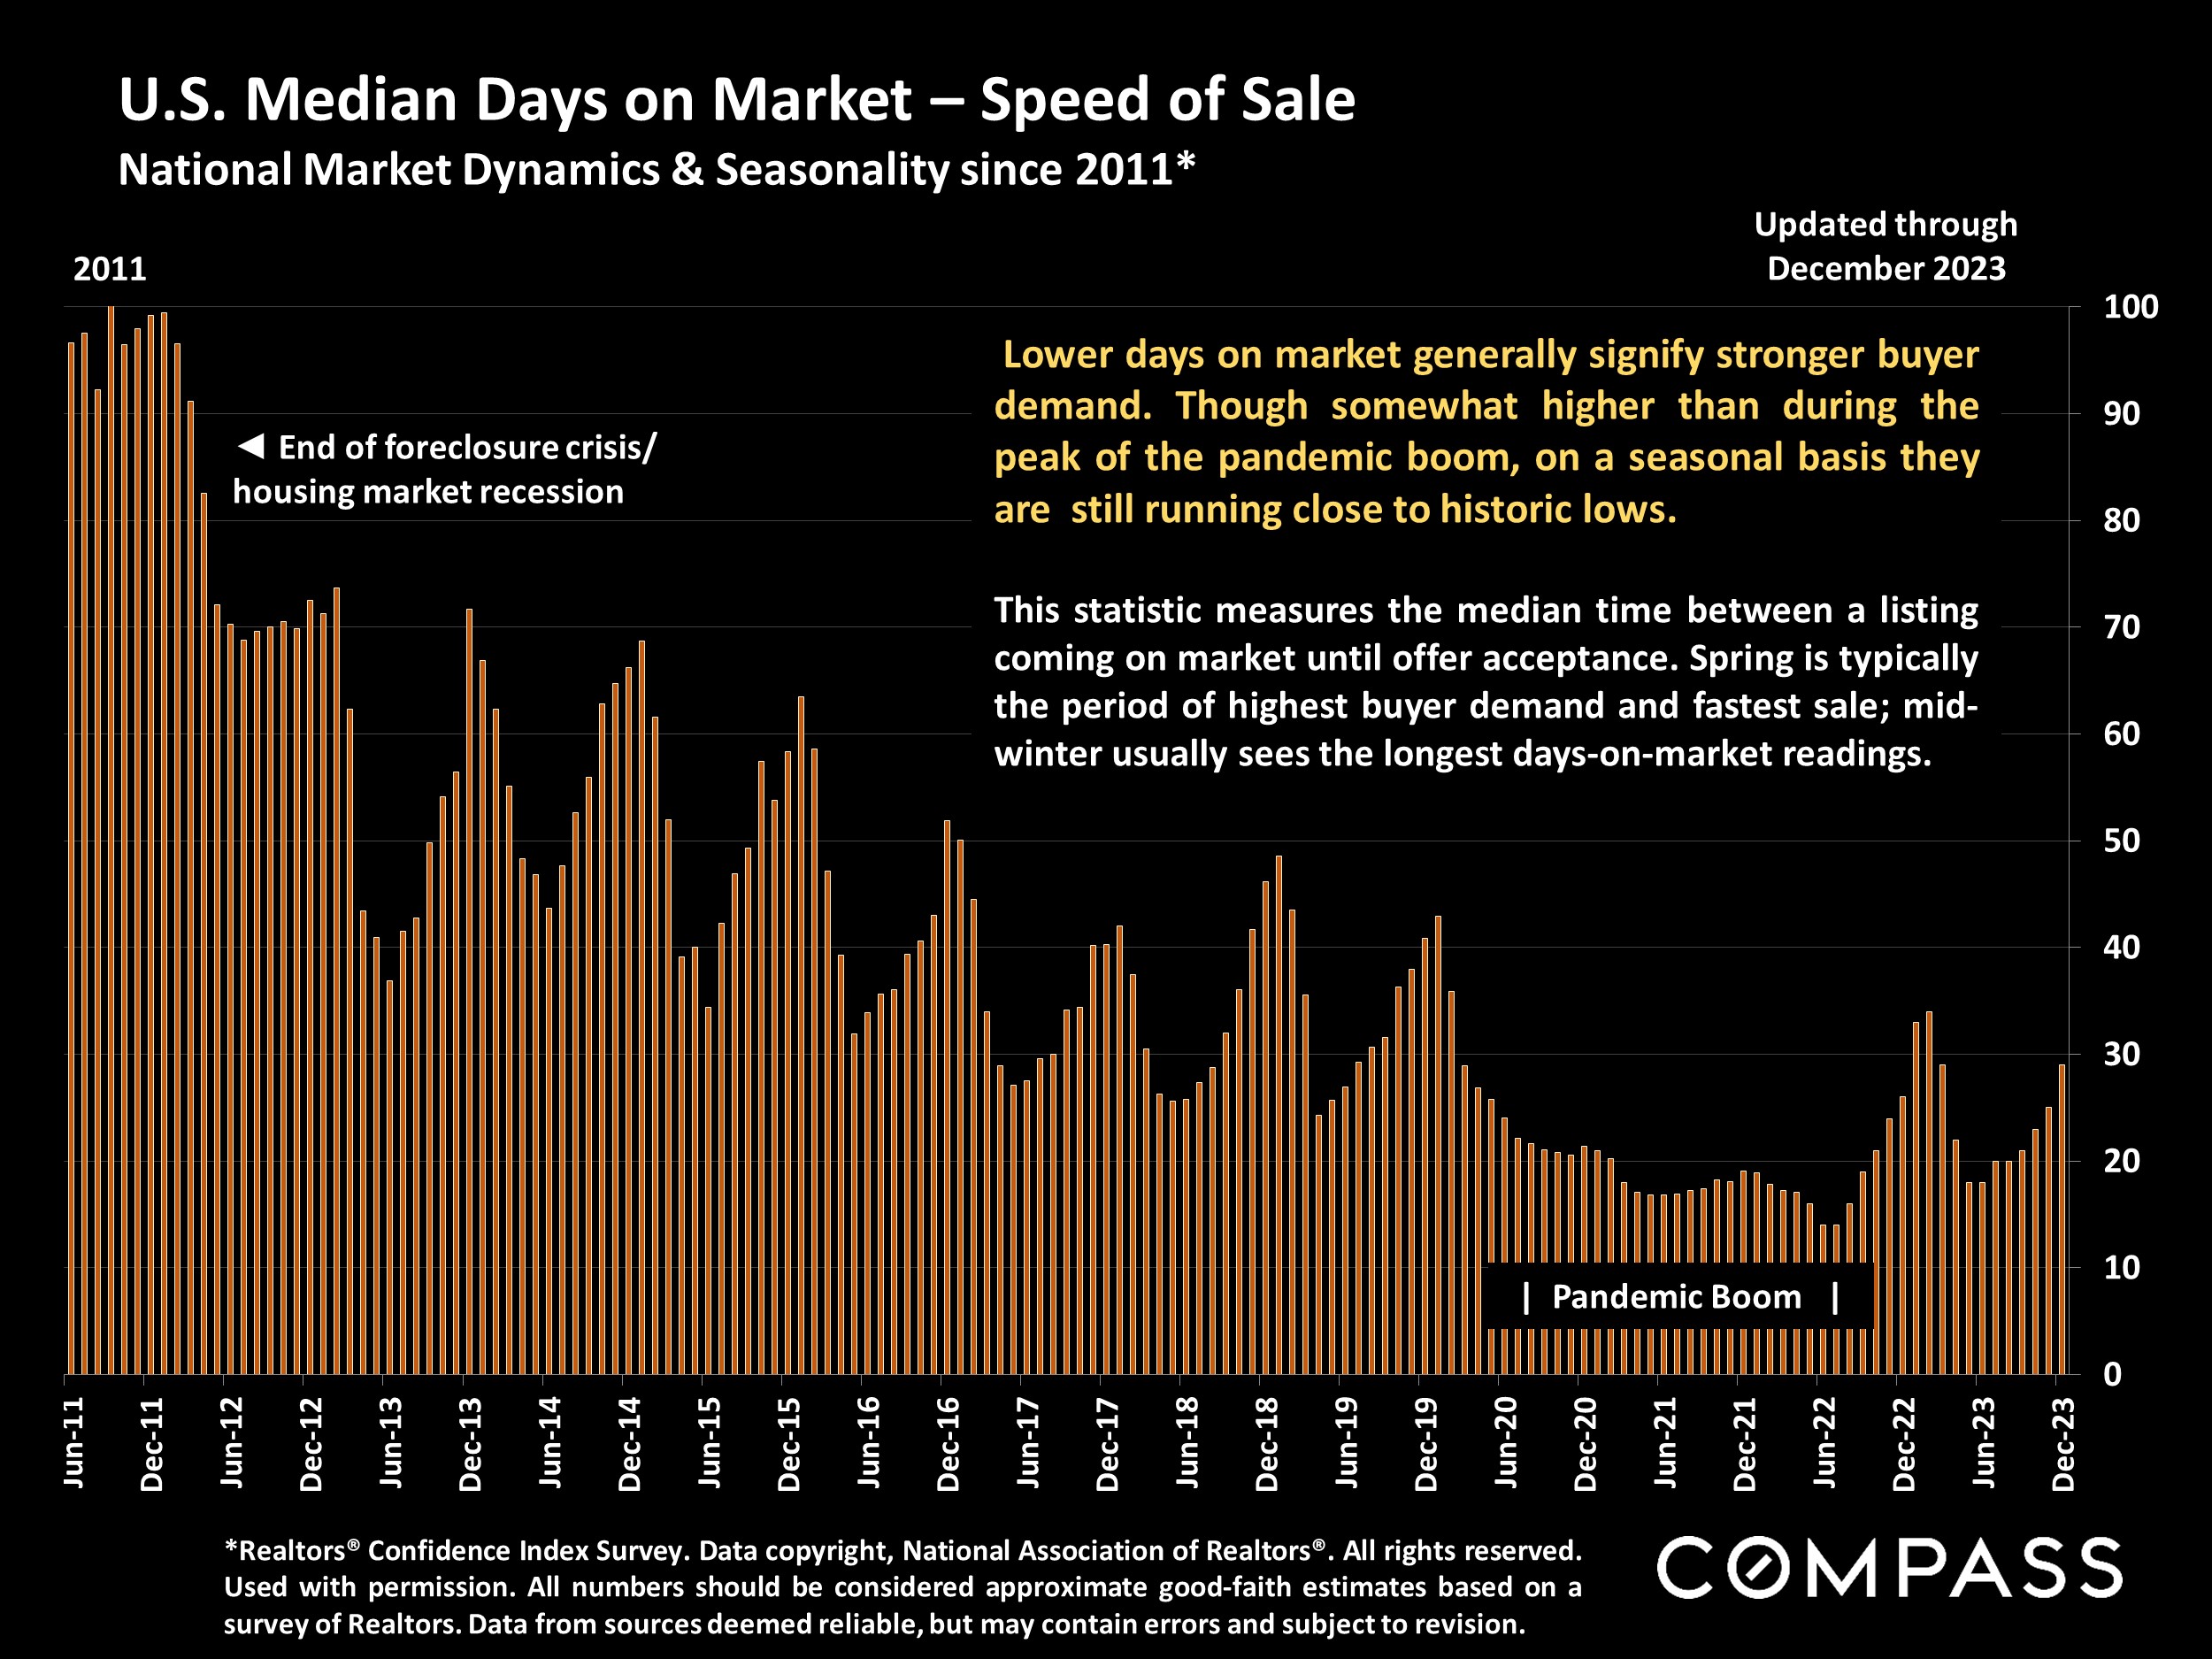
The speed at which homes go into contract reflects the heat of demand. As with almost all market indicators, it ebbs and flows by season.
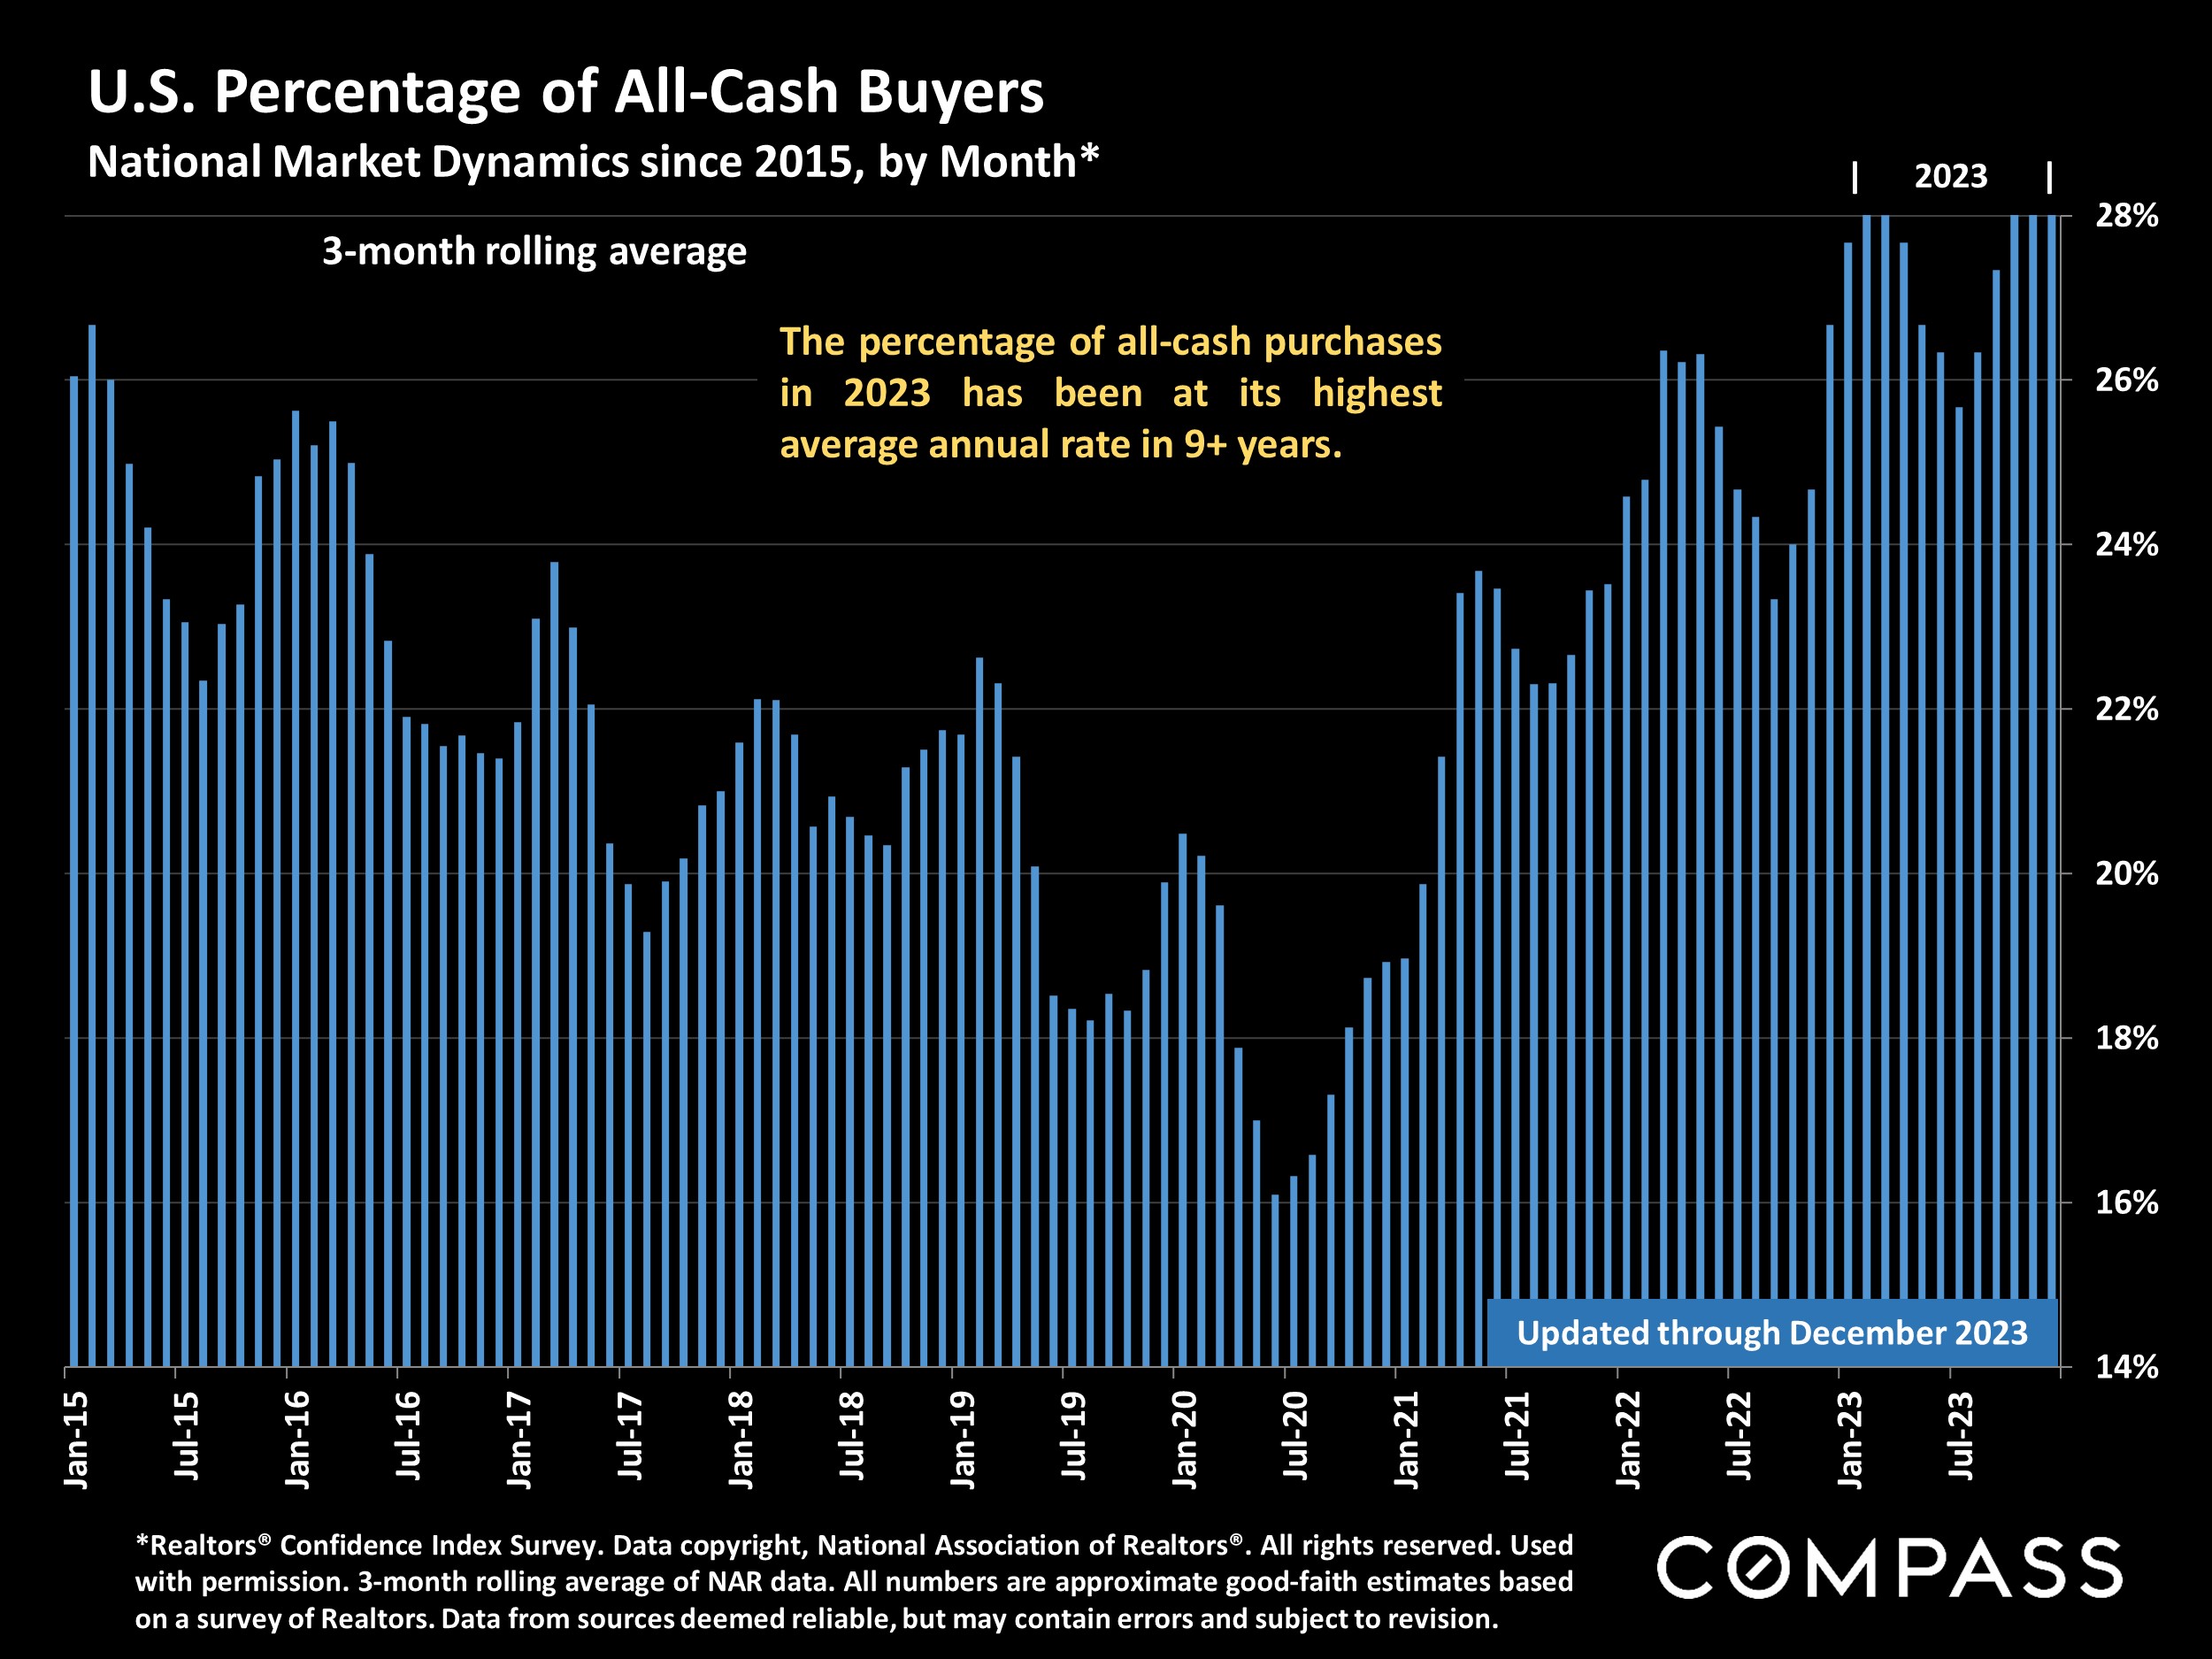
The percentage of all-cash sales remains very high by long-term standards. Undoubtedly, higher interest rates have been a major factor.
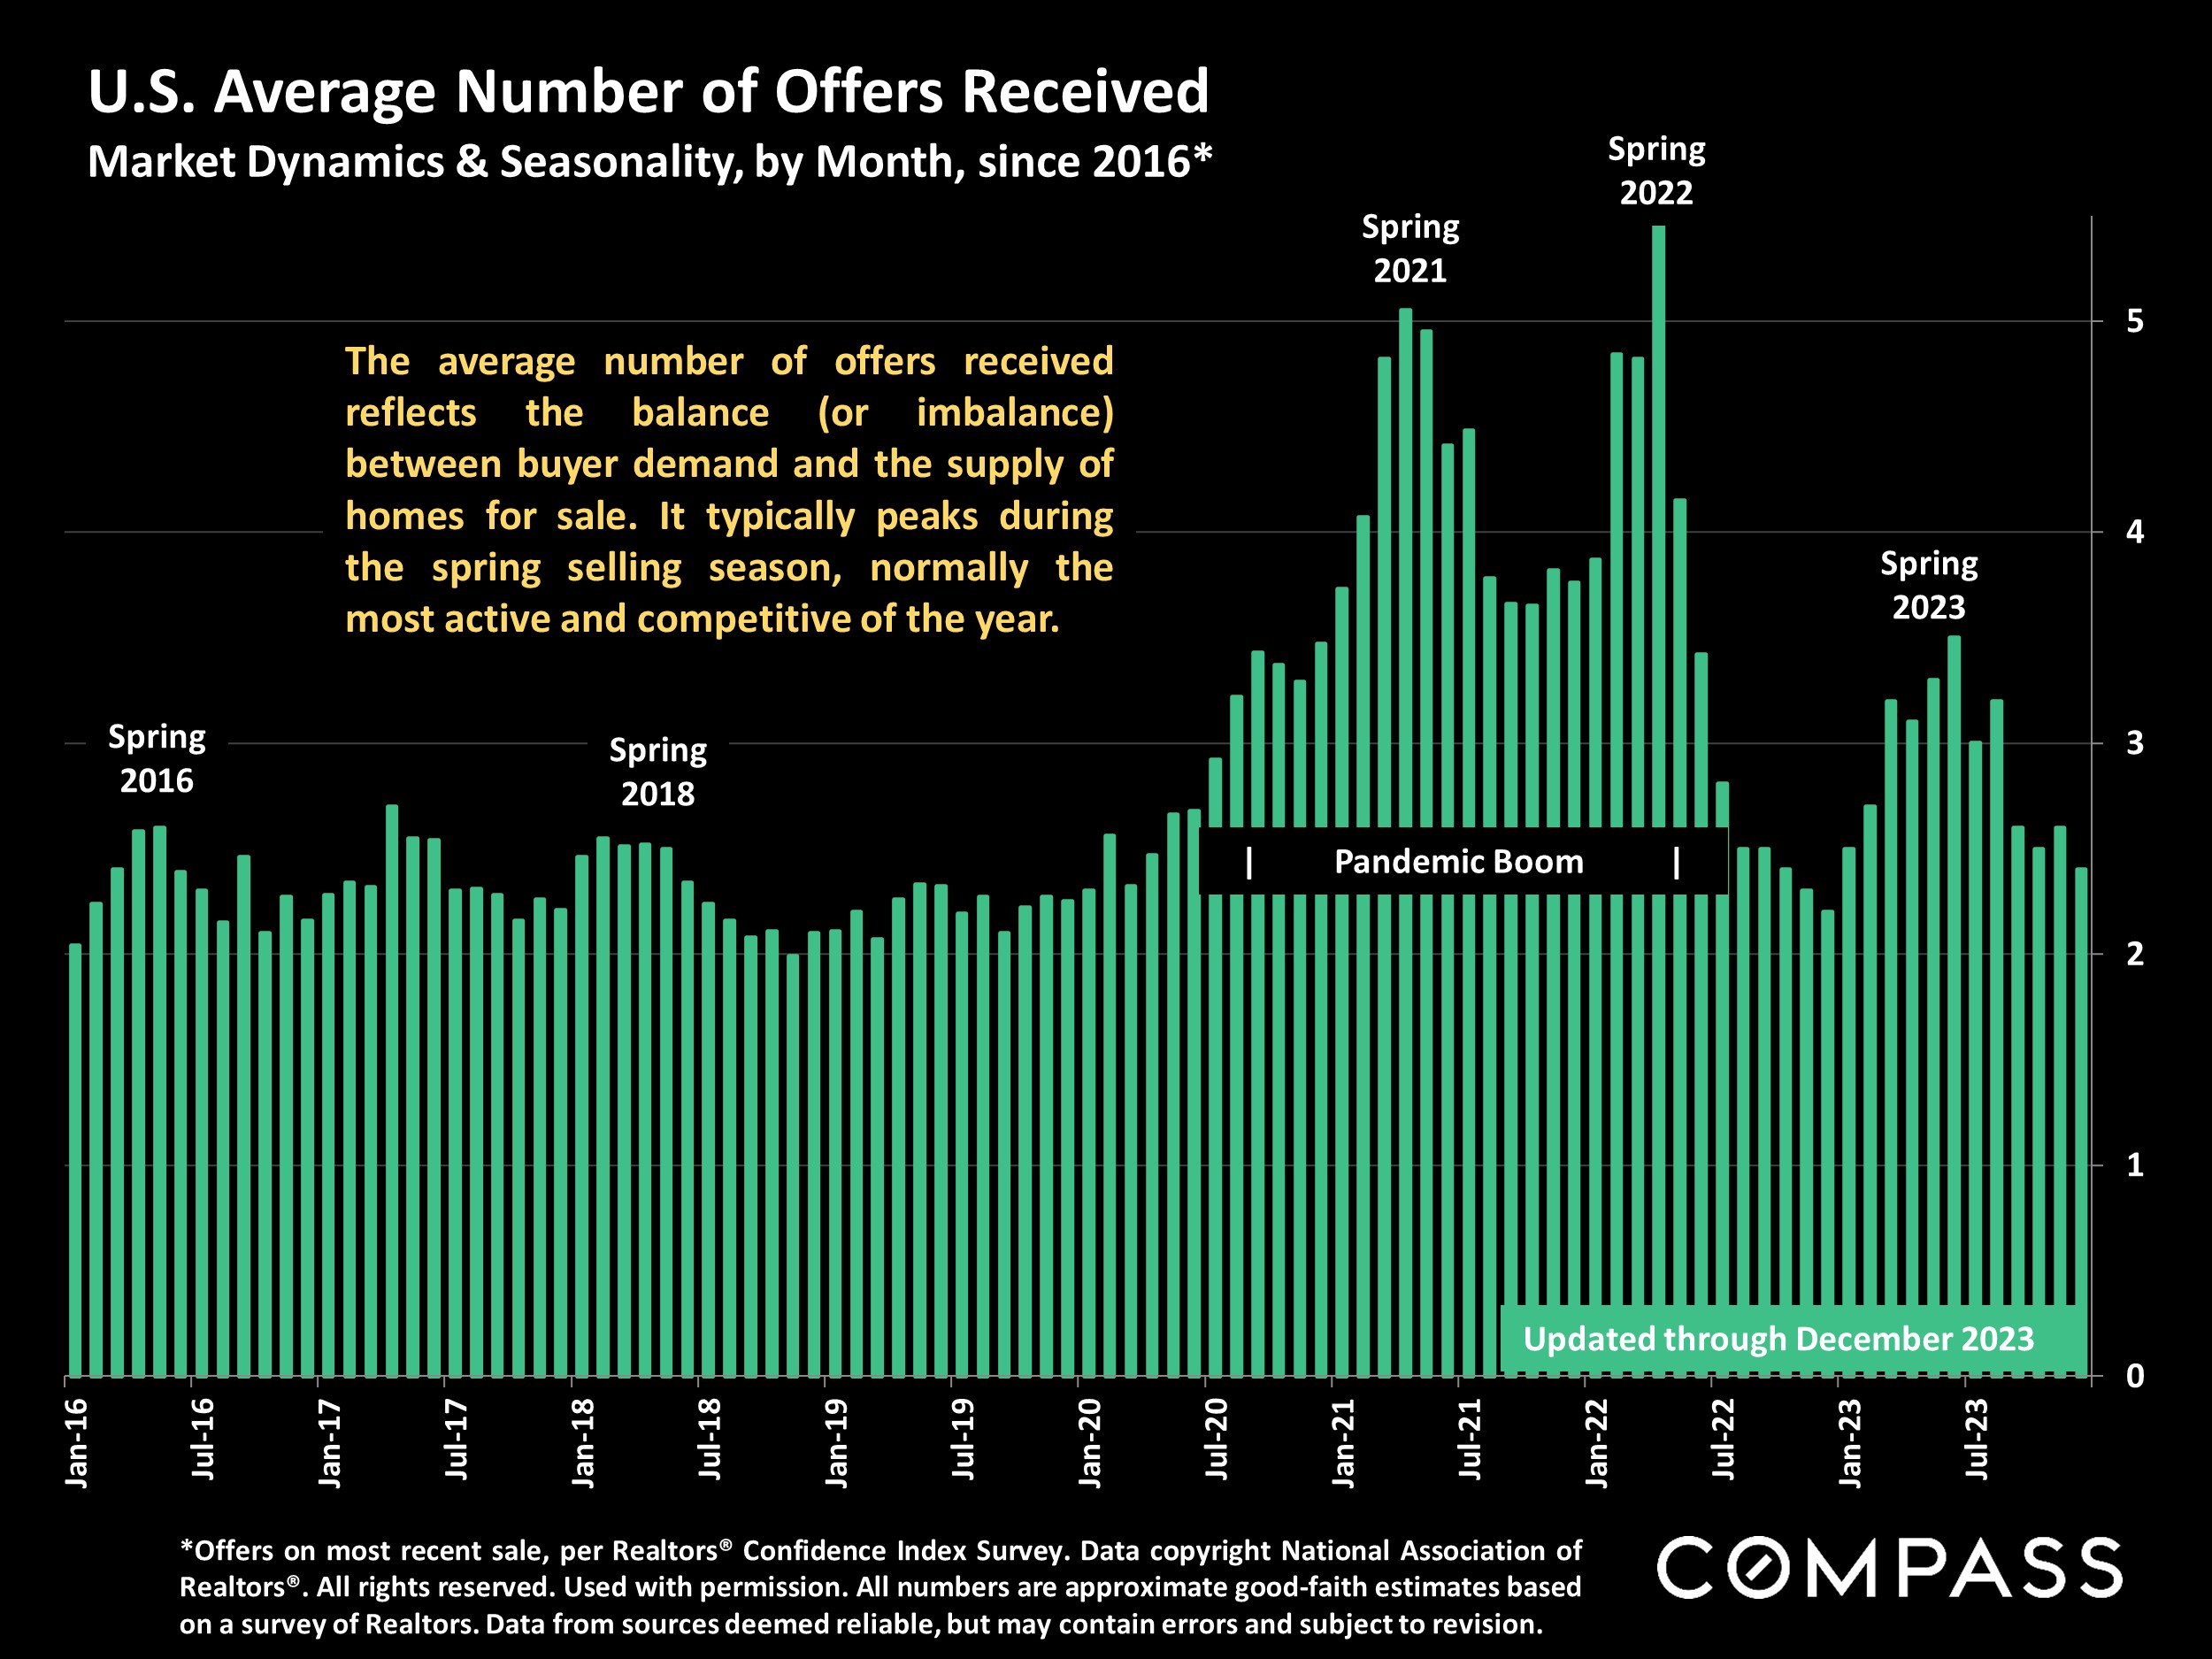
Multiple offers are an indication of buyers competing for a limited supply of well-priced listings. Competition is the main driver behind home-price increases.
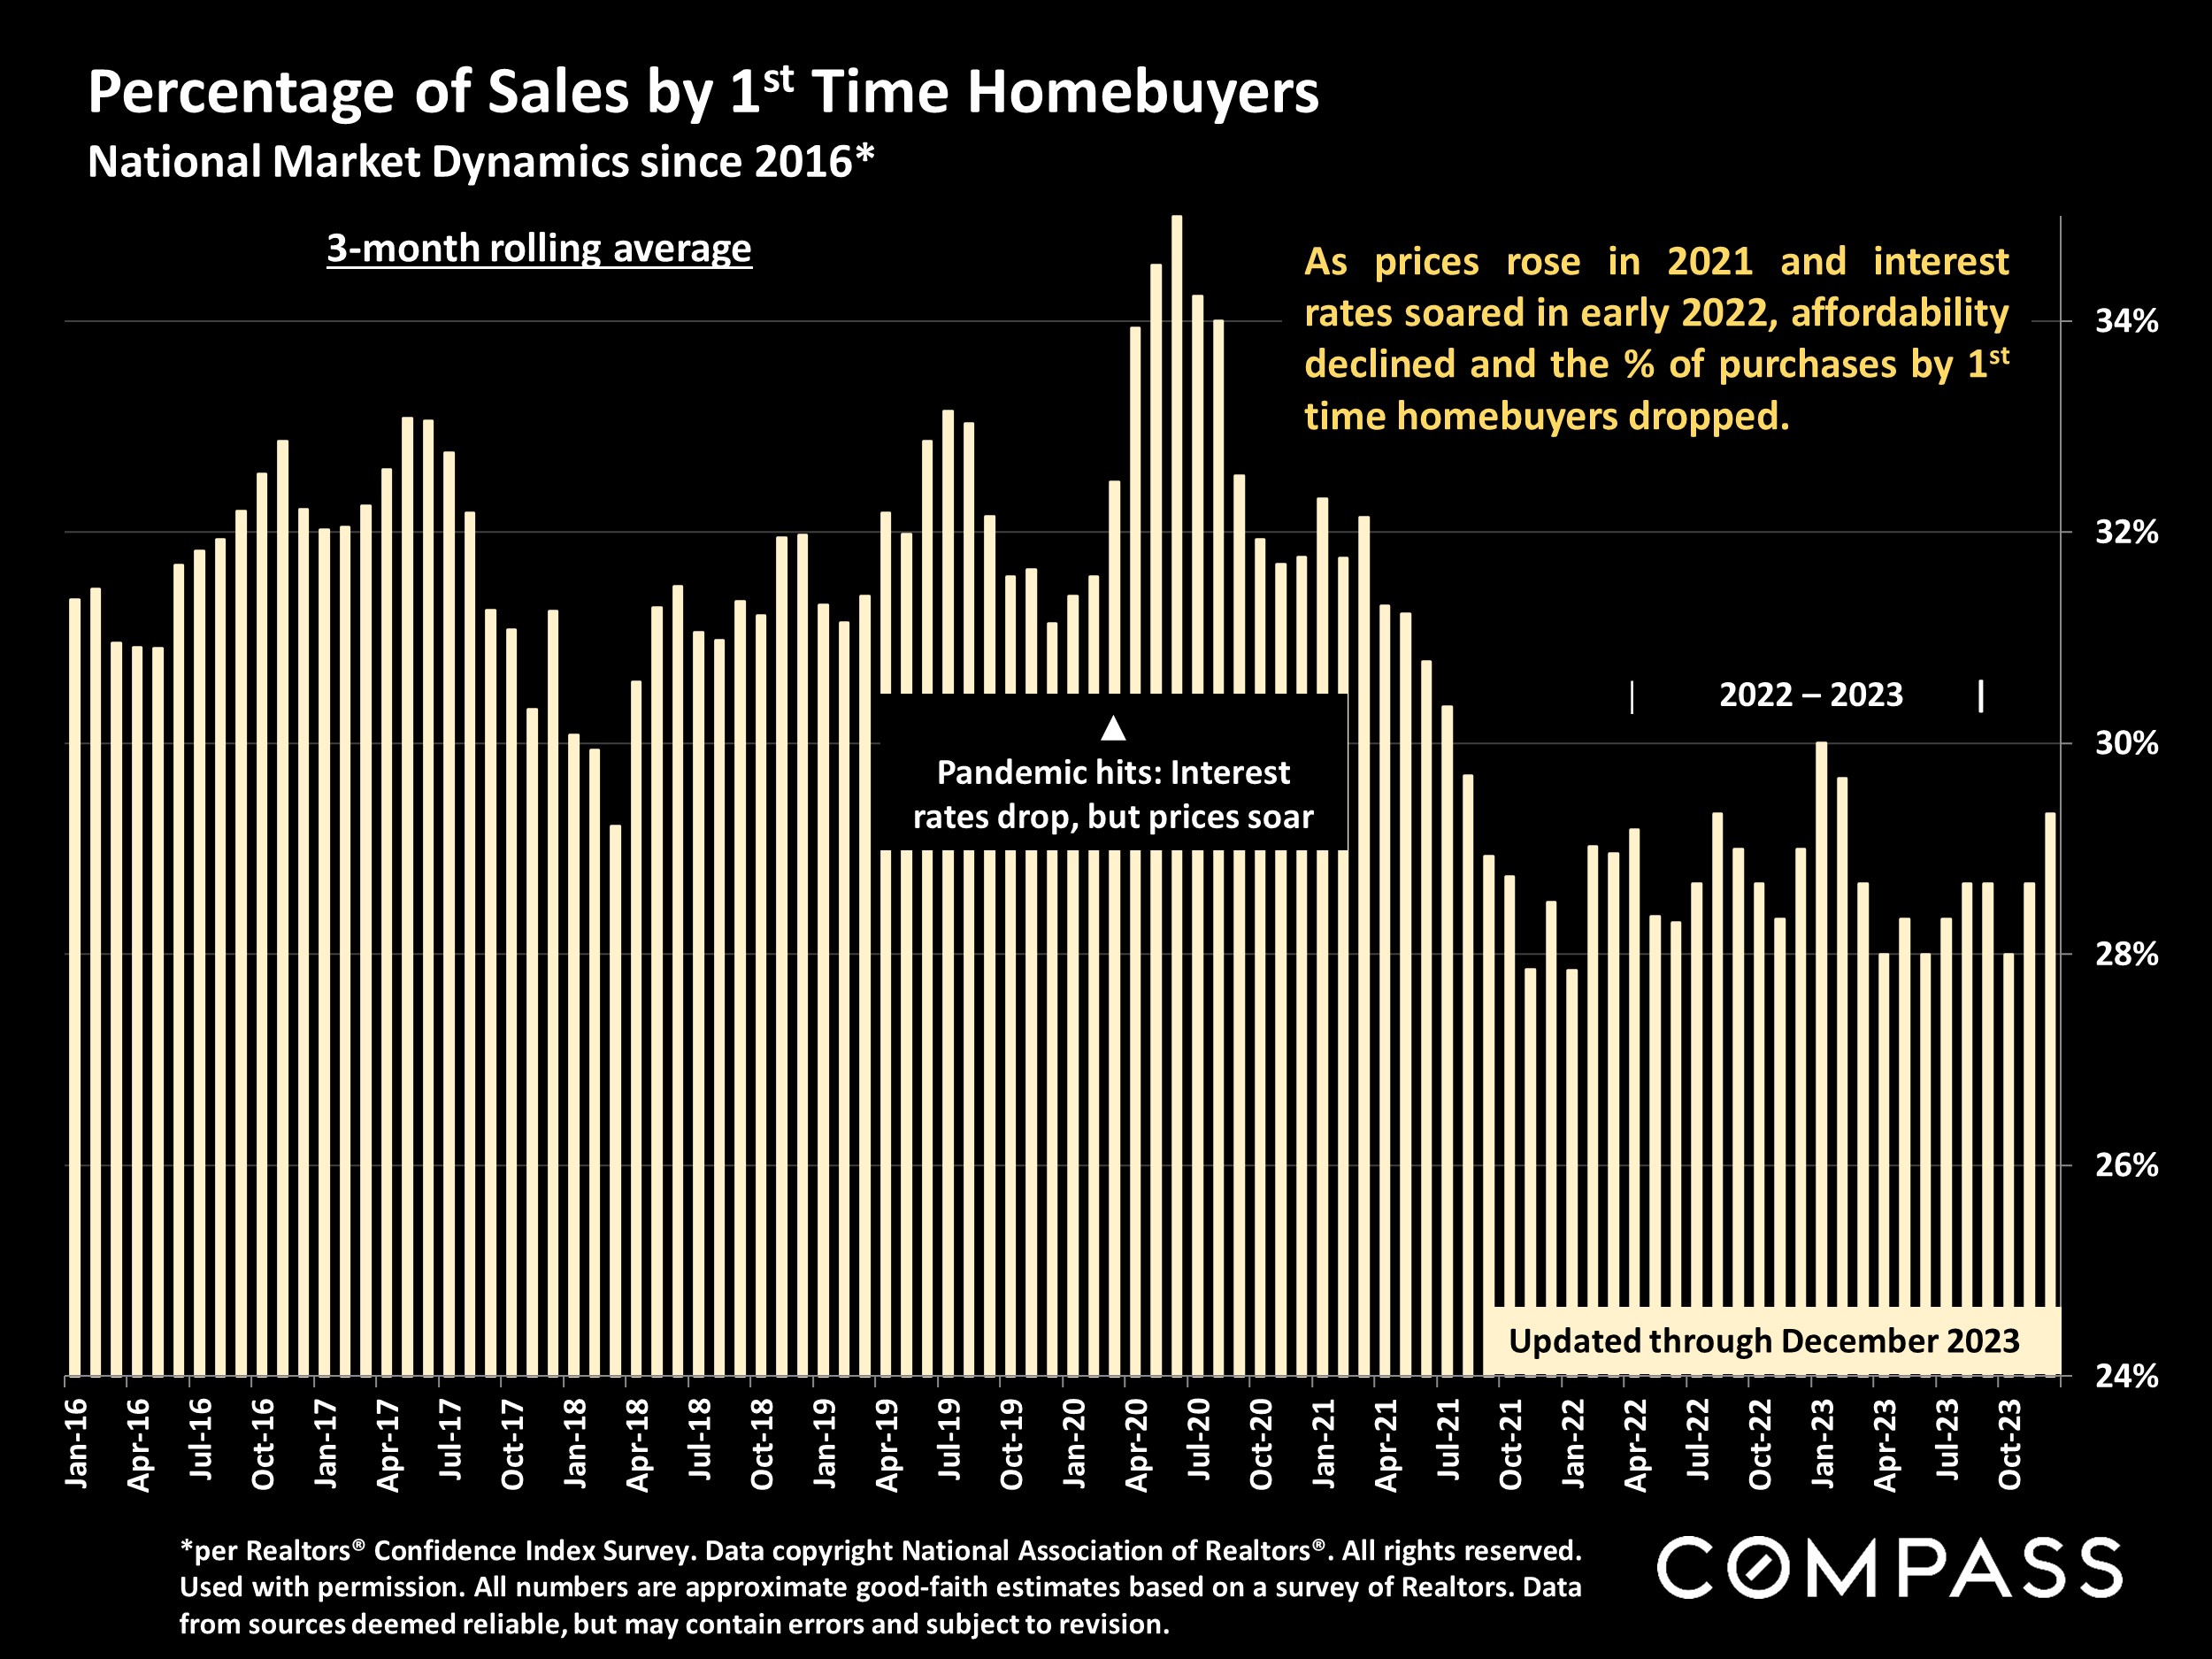
The % of first-time homebuyers remains low, a classic example of repressed demand: They want to buy, but economic conditions have not cooperated.
Please let me know if I can ever be of assistance, in any way,
to you or your family, friends and colleagues.
Ray Lyon
DRE# 01875162
Realtor®
M: 310.993.1065
ray.lyon@compass.com
SECTION
National and regional statistics are generalities, essentially summaries generated by thousands of unique, individual listings and sales occurring across different market segments. They are best seen not as precise measurements, but as broad, comparative indicators with reasonable margins of error. Anomalous fluctuations in statistics are not uncommon, and last period data should be considered preliminary estimates which may be revised in future updates. Different analytics programs sometimes define standard statistics differently – such as “active listings,” “days on market,” and “months supply of inventory”: What is most meaningful are not specific numeric calculations but the trends they illustrate. Data from sources deemed reliable, but may contain errors, and subject to revision. All numbers to be considered approximate, and how these analyses apply to any particular property is unknown without a specific comparative market analysis.
Compass is a real estate broker licensed by the State of California operating under multiple entities. License Numbers 01991628, 1527235, 1527365, 1356742, 1443761, 1997075, 1935359, 1961027, 1842987, 1869607, 1866771, 1527205, 1079009, 1272467. All material is intended for informational purposes only and is compiled from sources deemed reliable but is subject to errors, omissions, changes in price, condition, sale, or withdrawal without notice. No statement is made as to the accuracy of any description or measurements (including square footage). This is not intended to solicit property already listed. No financial or legal advice provided. Equal Housing Opportunity. Photos may be virtually staged or digitally enhanced and may not reflect actual property conditions.